Measure, explain and decide on paid media.
Practical guides on attribution, client reporting and business metrics, with sources and examples you can reproduce.
Start here
The articles that help most if you are organizing your measurement right now.

AI & analytics
AI-ready marketing data: what to fix before you ask
Campaign names, UTMs, one definition per conversion, currency, time zone and a linked CRM. The checklist that keeps AI from being confidently wrong.
9 min read

Agency reporting
A client report is a product, not an attachment
The monthly report answers three questions, in this order: did we hit the goal, why, and what comes next. See the structure, the ritual and common mistakes.
8 min read
All articles
28 articles
Agency reporting
Goals your client understands: from target revenue to media budget
Start from the revenue your client wants and work backwards: average order, conversion and cost per visit reveal the budget and ROAS you need.
6 min read

Agency reporting
How to present a bad month without losing the client
Fact, cause, plan and ask: a structure to explain a bad result to a client with numbers, evidence and a next step, without excuses or surprises.
8 min read

Marketing data
Click date or sale date? How each platform counts it
Google Ads dates a conversion by the click, GA4 by the sale. See why last month still changes, a worked example with checked math and how to close the month.
6 min read

Marketing data
Metrics dictionary: build one with your client in a single meeting
A metrics dictionary ends the argument over which number is right. See the columns, a worked example and an agenda for a 60-minute meeting.
7 min read

Marketing data
Server-side tagging: when it pays off and when it's hype
Server-side tagging has a fixed cost and does not replace consent. See what the official docs promise, what it costs, the alternatives and how to decide.
6 min read

Marketing data
Thresholds and missing data in GA4: when numbers vanish
Data thresholds, sampling and the (other) row make GA4 numbers vanish or change. Learn to tell them apart and what to do, with official sources.
7 min read

Marketing data
Incrementality on a small budget: holdout tests for SMBs
Incrementality is the sale that only happened because of the ad. Measure it with a simple geo holdout, with the math shown, without a big-brand budget.
6 min read

Marketing data
Reach, frequency and users: why you can't add them up
Reach, frequency and users count unique people, so adding rows inflates the total. See what Meta, Google Ads and GA4 say and how to report them.
7 min read
Marketing data
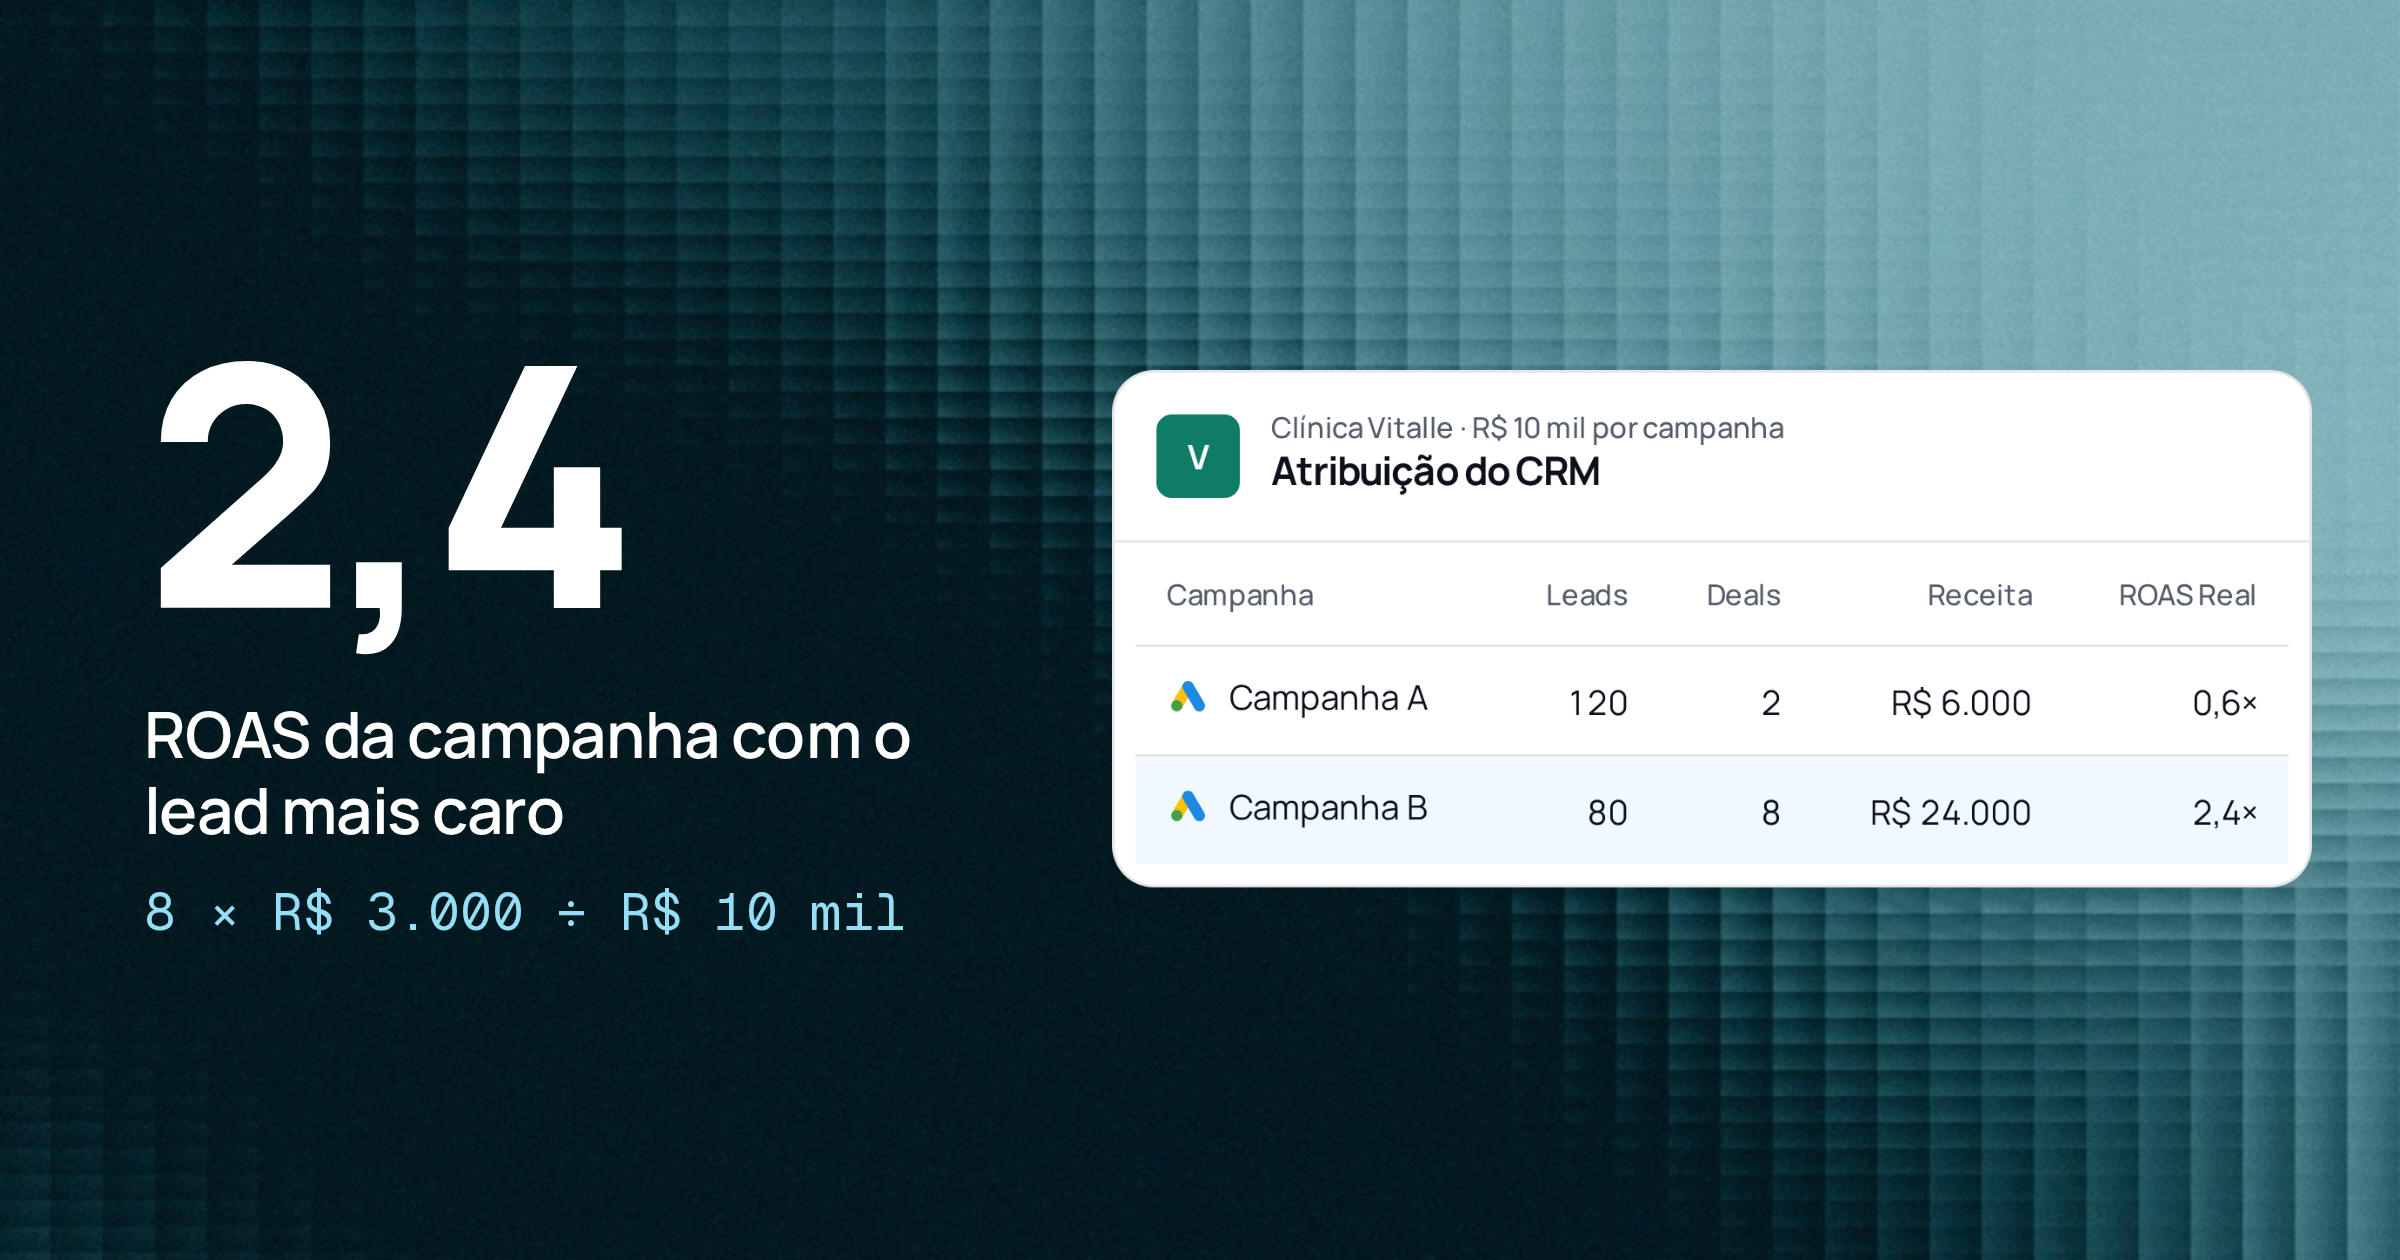
How to send CRM sales back to your ad platforms
A lead becomes a sale in the CRM, but Meta and Google only know the form. See what to store at click time, what to send back and today's deadlines.
8 min read

Marketing data
Time zone and currency: the silent error that misaligns reports
Each account closes the day in its own time zone and keeps one currency. See what the platforms let you change and how to align everything before month-end.
7 min read

Marketing data
Consent Mode v2 and LGPD: what changes in your numbers
What Consent Mode sends to Google, when modeling kicks in, how declined cookies affect conversions and how to explain the drop to a client.
8 min read

Marketing data
Google Ads enhanced conversions: when they are worth it
How enhanced conversions work for web and for leads, what to send hashed, what the account gains and where consent comes in.
8 min read
Marketing data
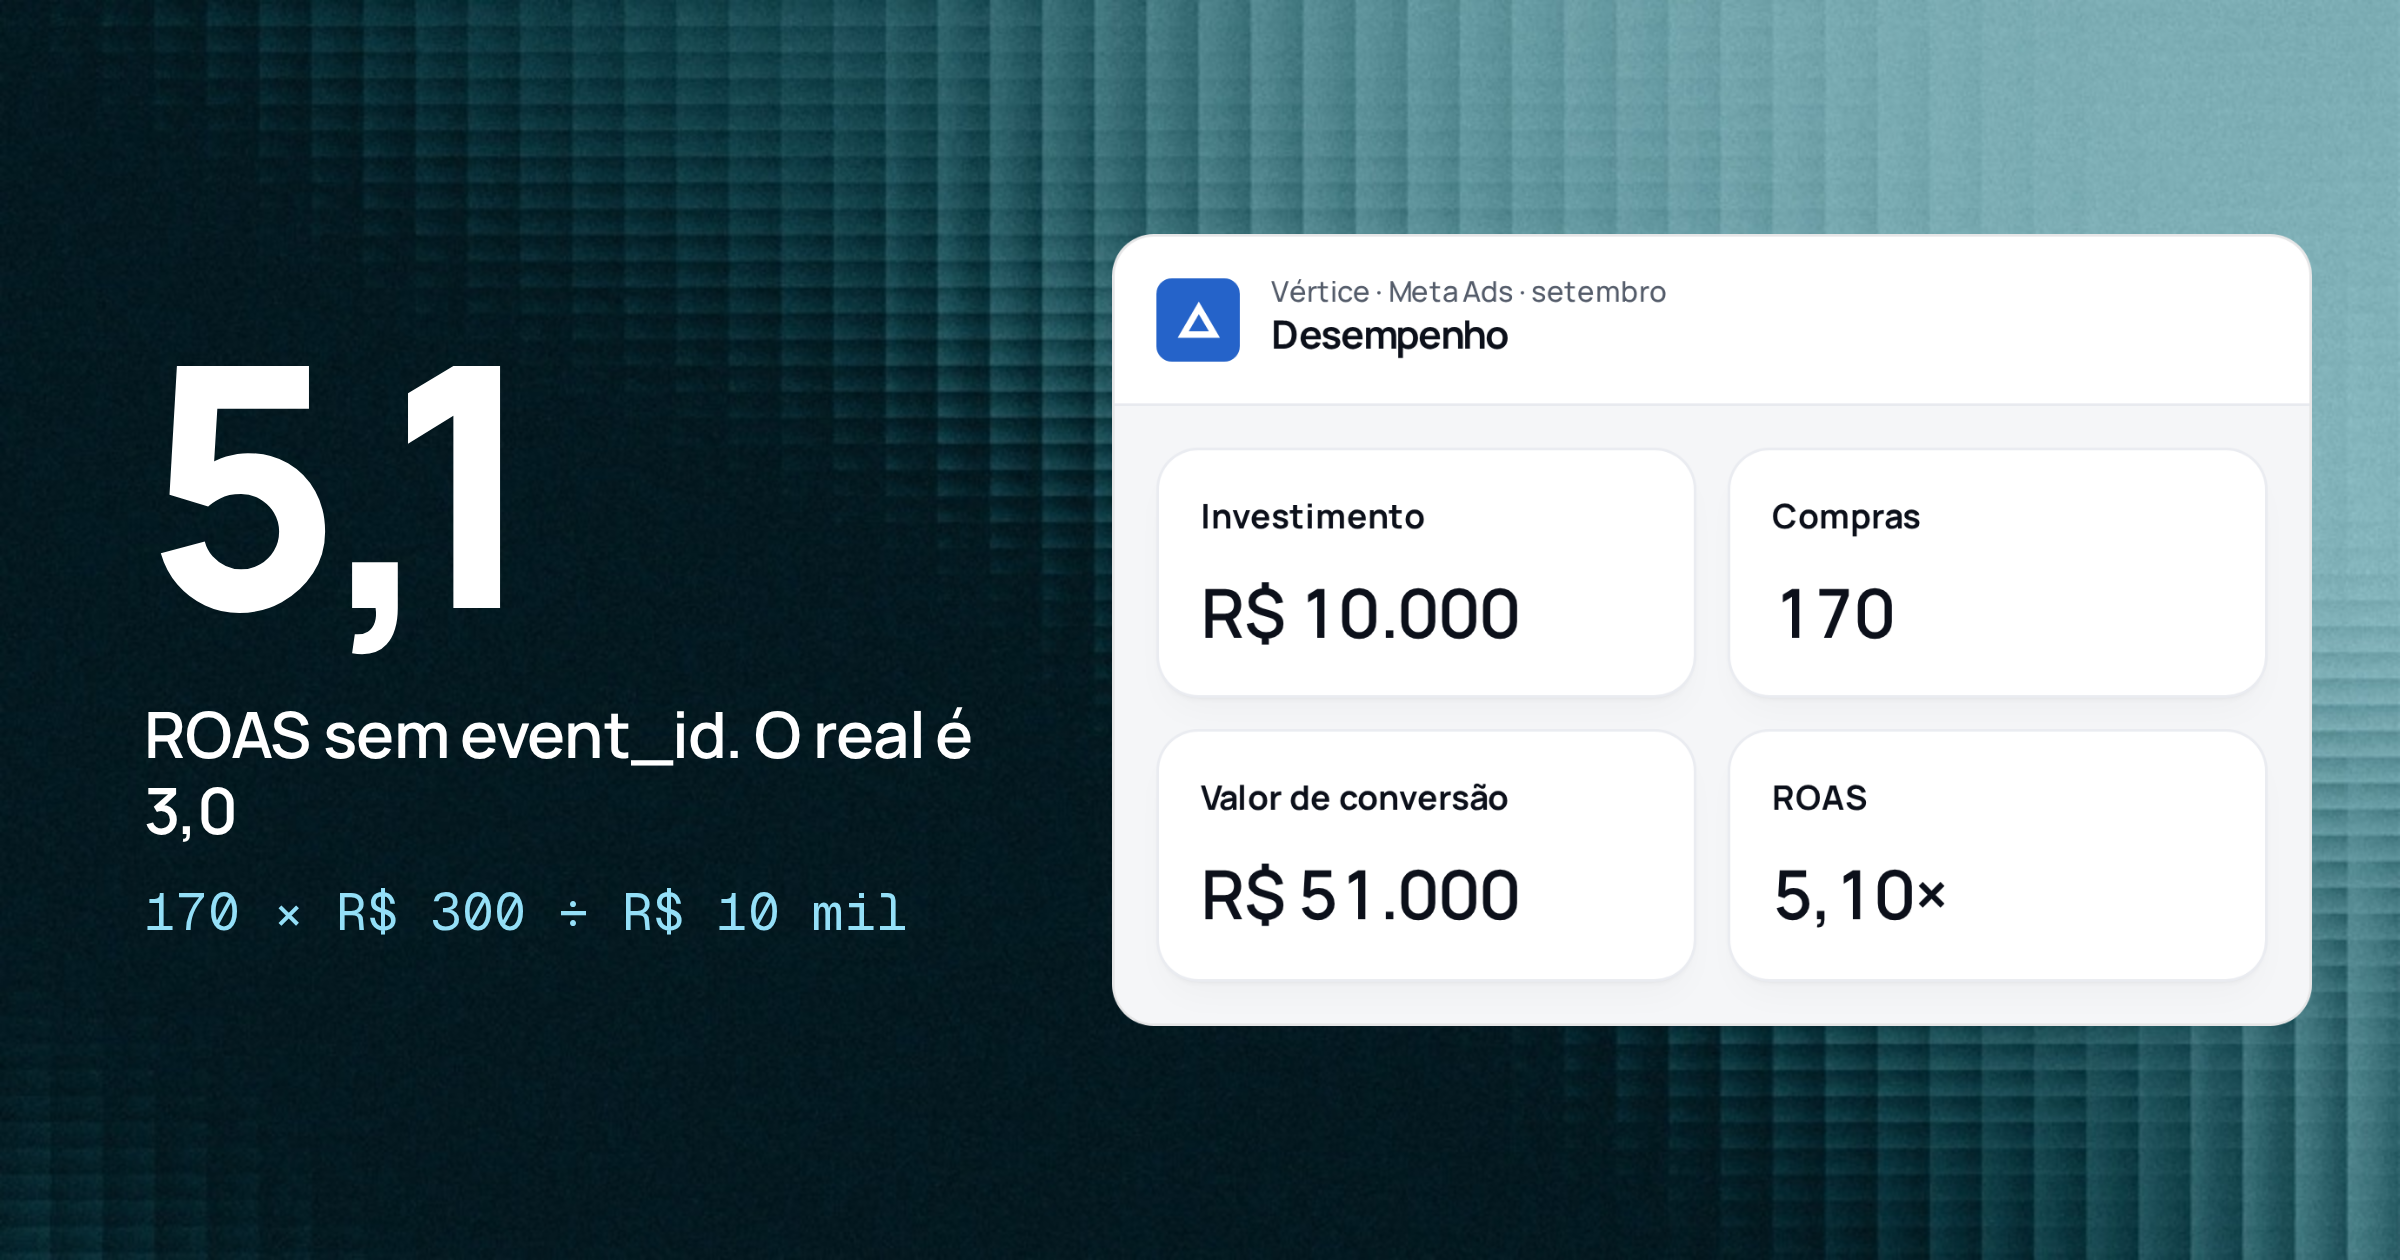
Meta's Conversions API explained for non-developers
What the Conversions API solves, how to avoid counting a purchase twice with event_id, and what helps Meta recognize who bought.
7 min read

Agency reporting
The one-page monthly report: an annotated template
Result, reasons, next steps and appendix. See a one-page monthly report template, with a numeric example and what to cut.
6 min read
Performance strategy
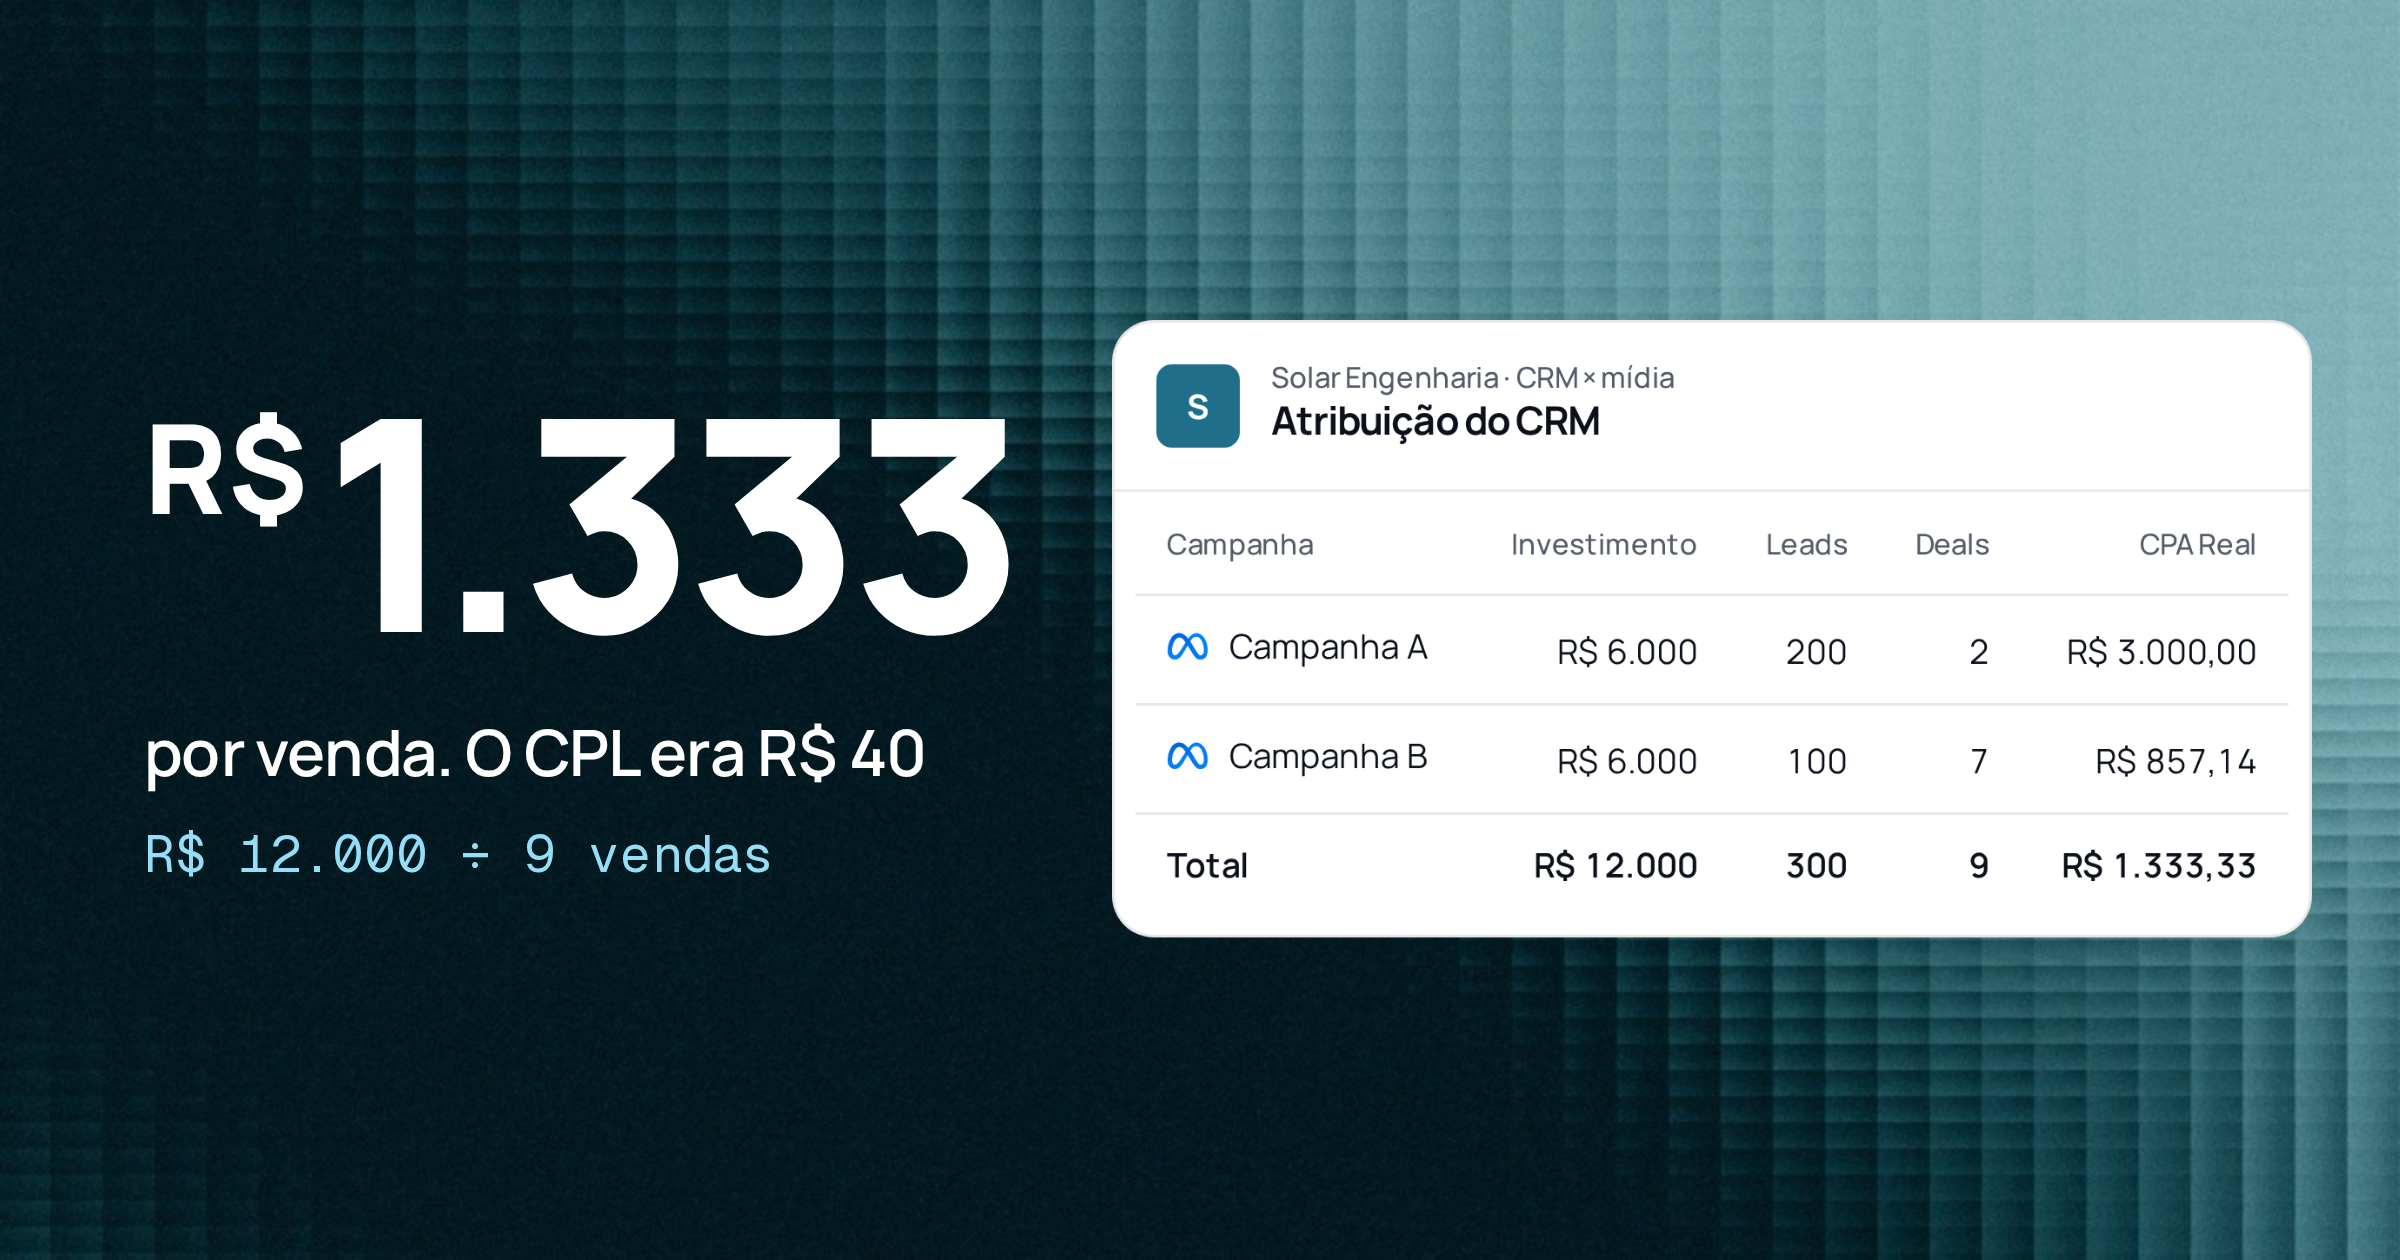
Cost per lead is a vanity metric; cost per qualified lead is not
A cheap lead can be expensive per sale. See how to define MQL and SQL with your client and send CRM status back to your ad platforms.
7 min read
Performance strategy
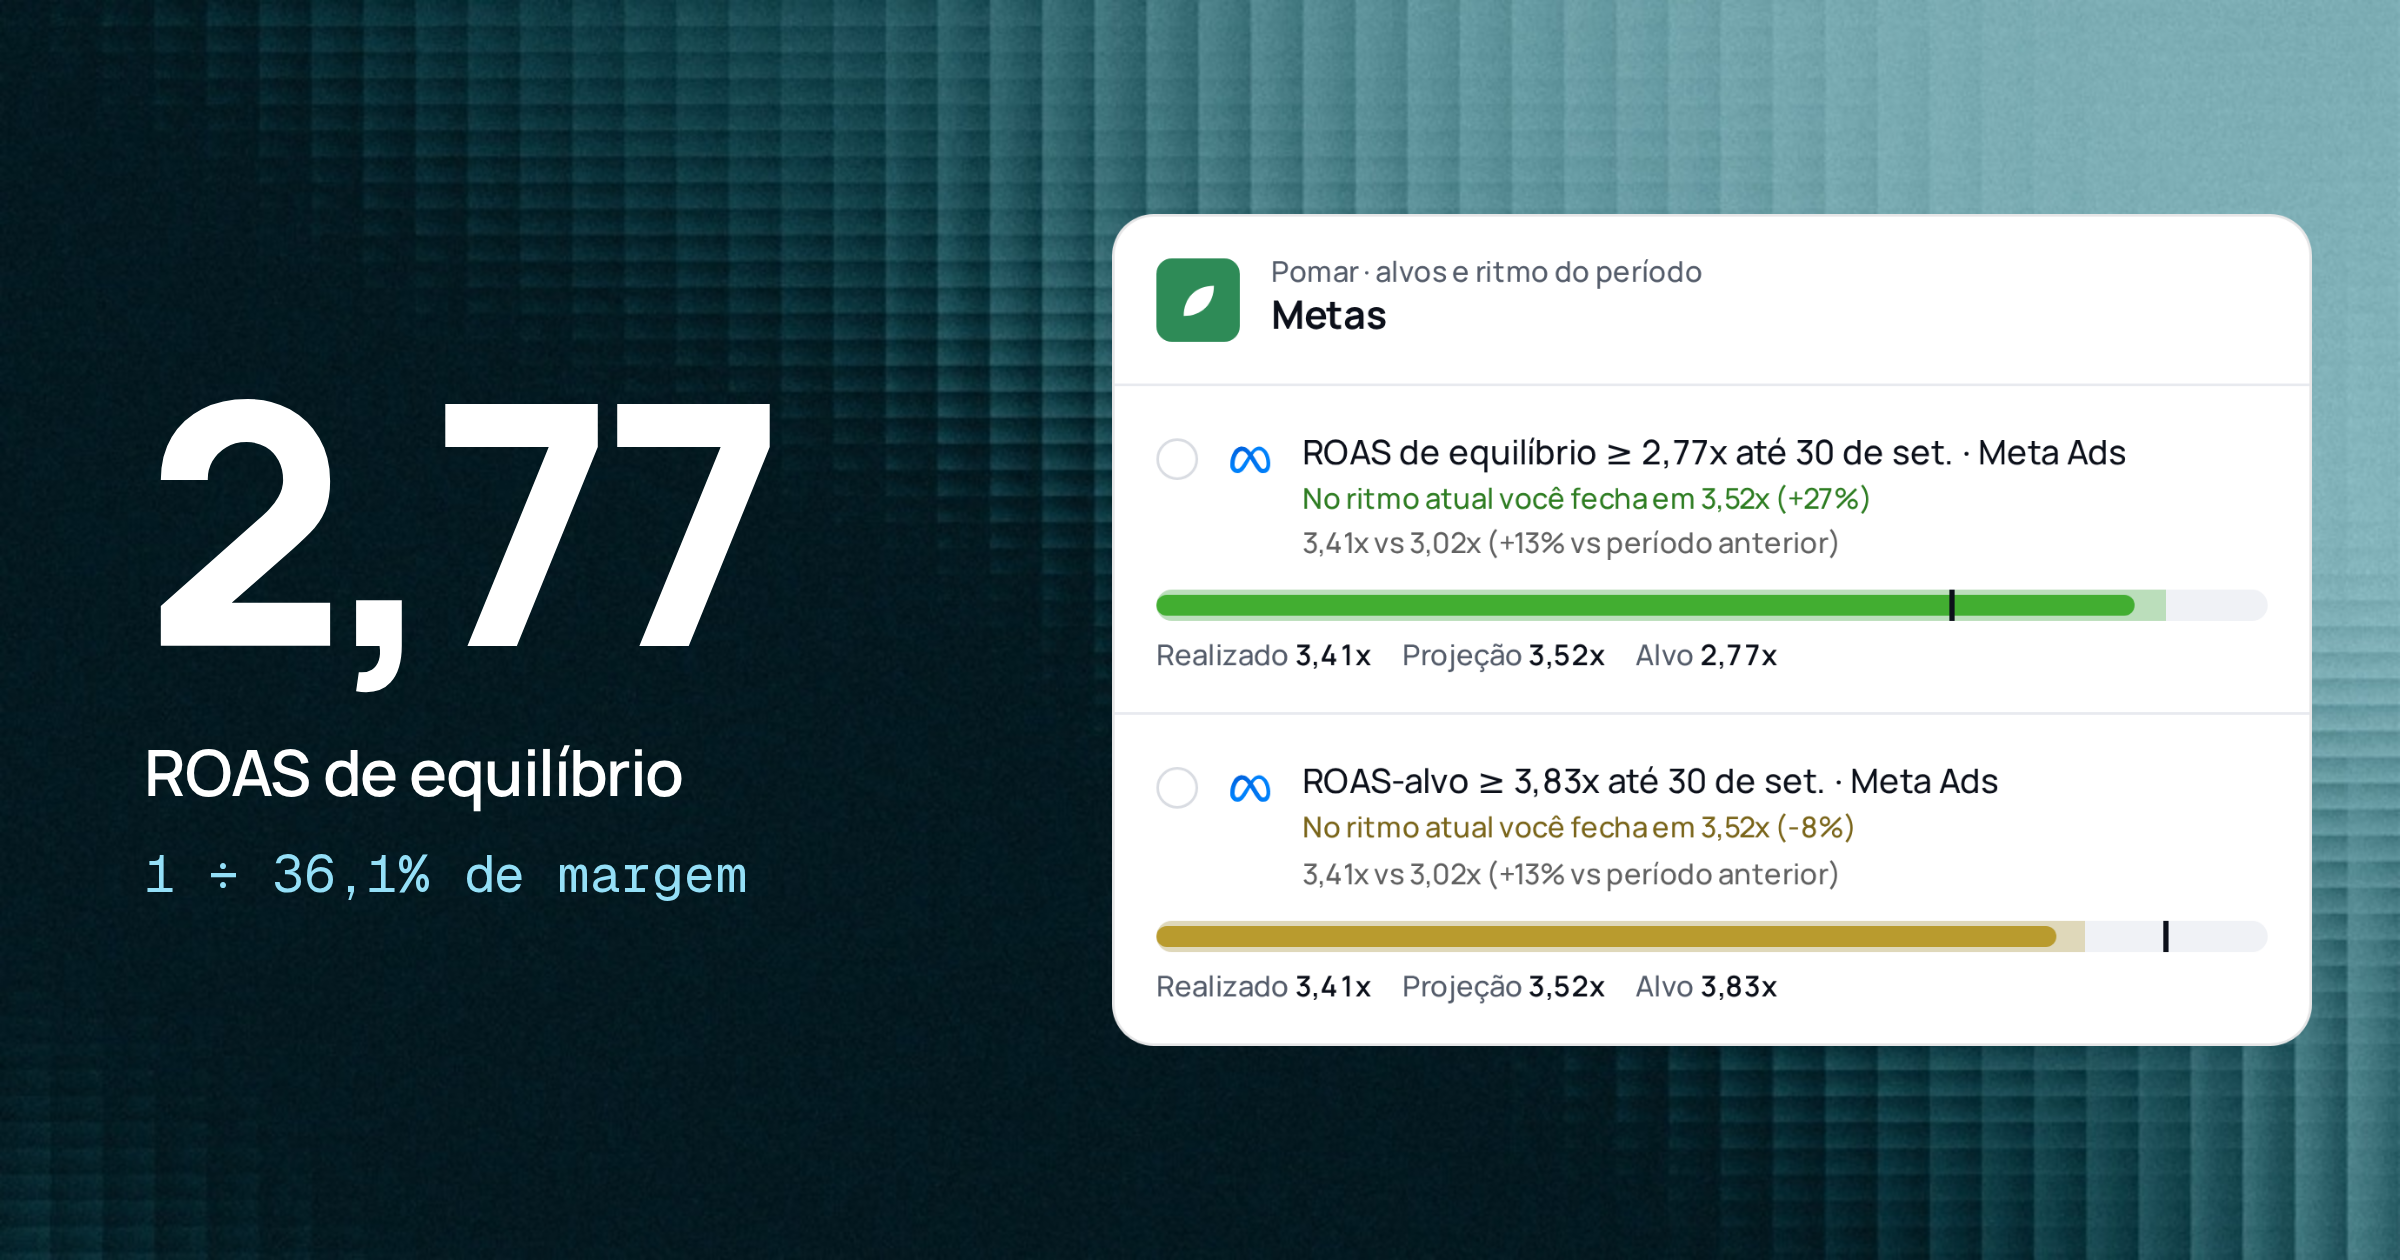
Break-even ROAS: the math every e-commerce store should do before raising budget
Break-even ROAS is 1 divided by contribution margin. See how to calculate it with shipping, taxes and returns, and when a ROAS of 3 loses money.
8 min read

Marketing data
Meta attribution windows: how to compare periods without fooling yourself
On Jan 12, 2026 the Meta API stopped returning the 7-day and 28-day view windows. See what changed and how to compare periods correctly.
6 min read

Marketing data
GA4 key events, conversions and what Google Ads imports
A key event belongs to GA4; a conversion is what Google Ads uses to measure and bid. See the difference, the counting and how to import without double counting.
7 min read
Marketing data
Campaign naming: the name is your first report
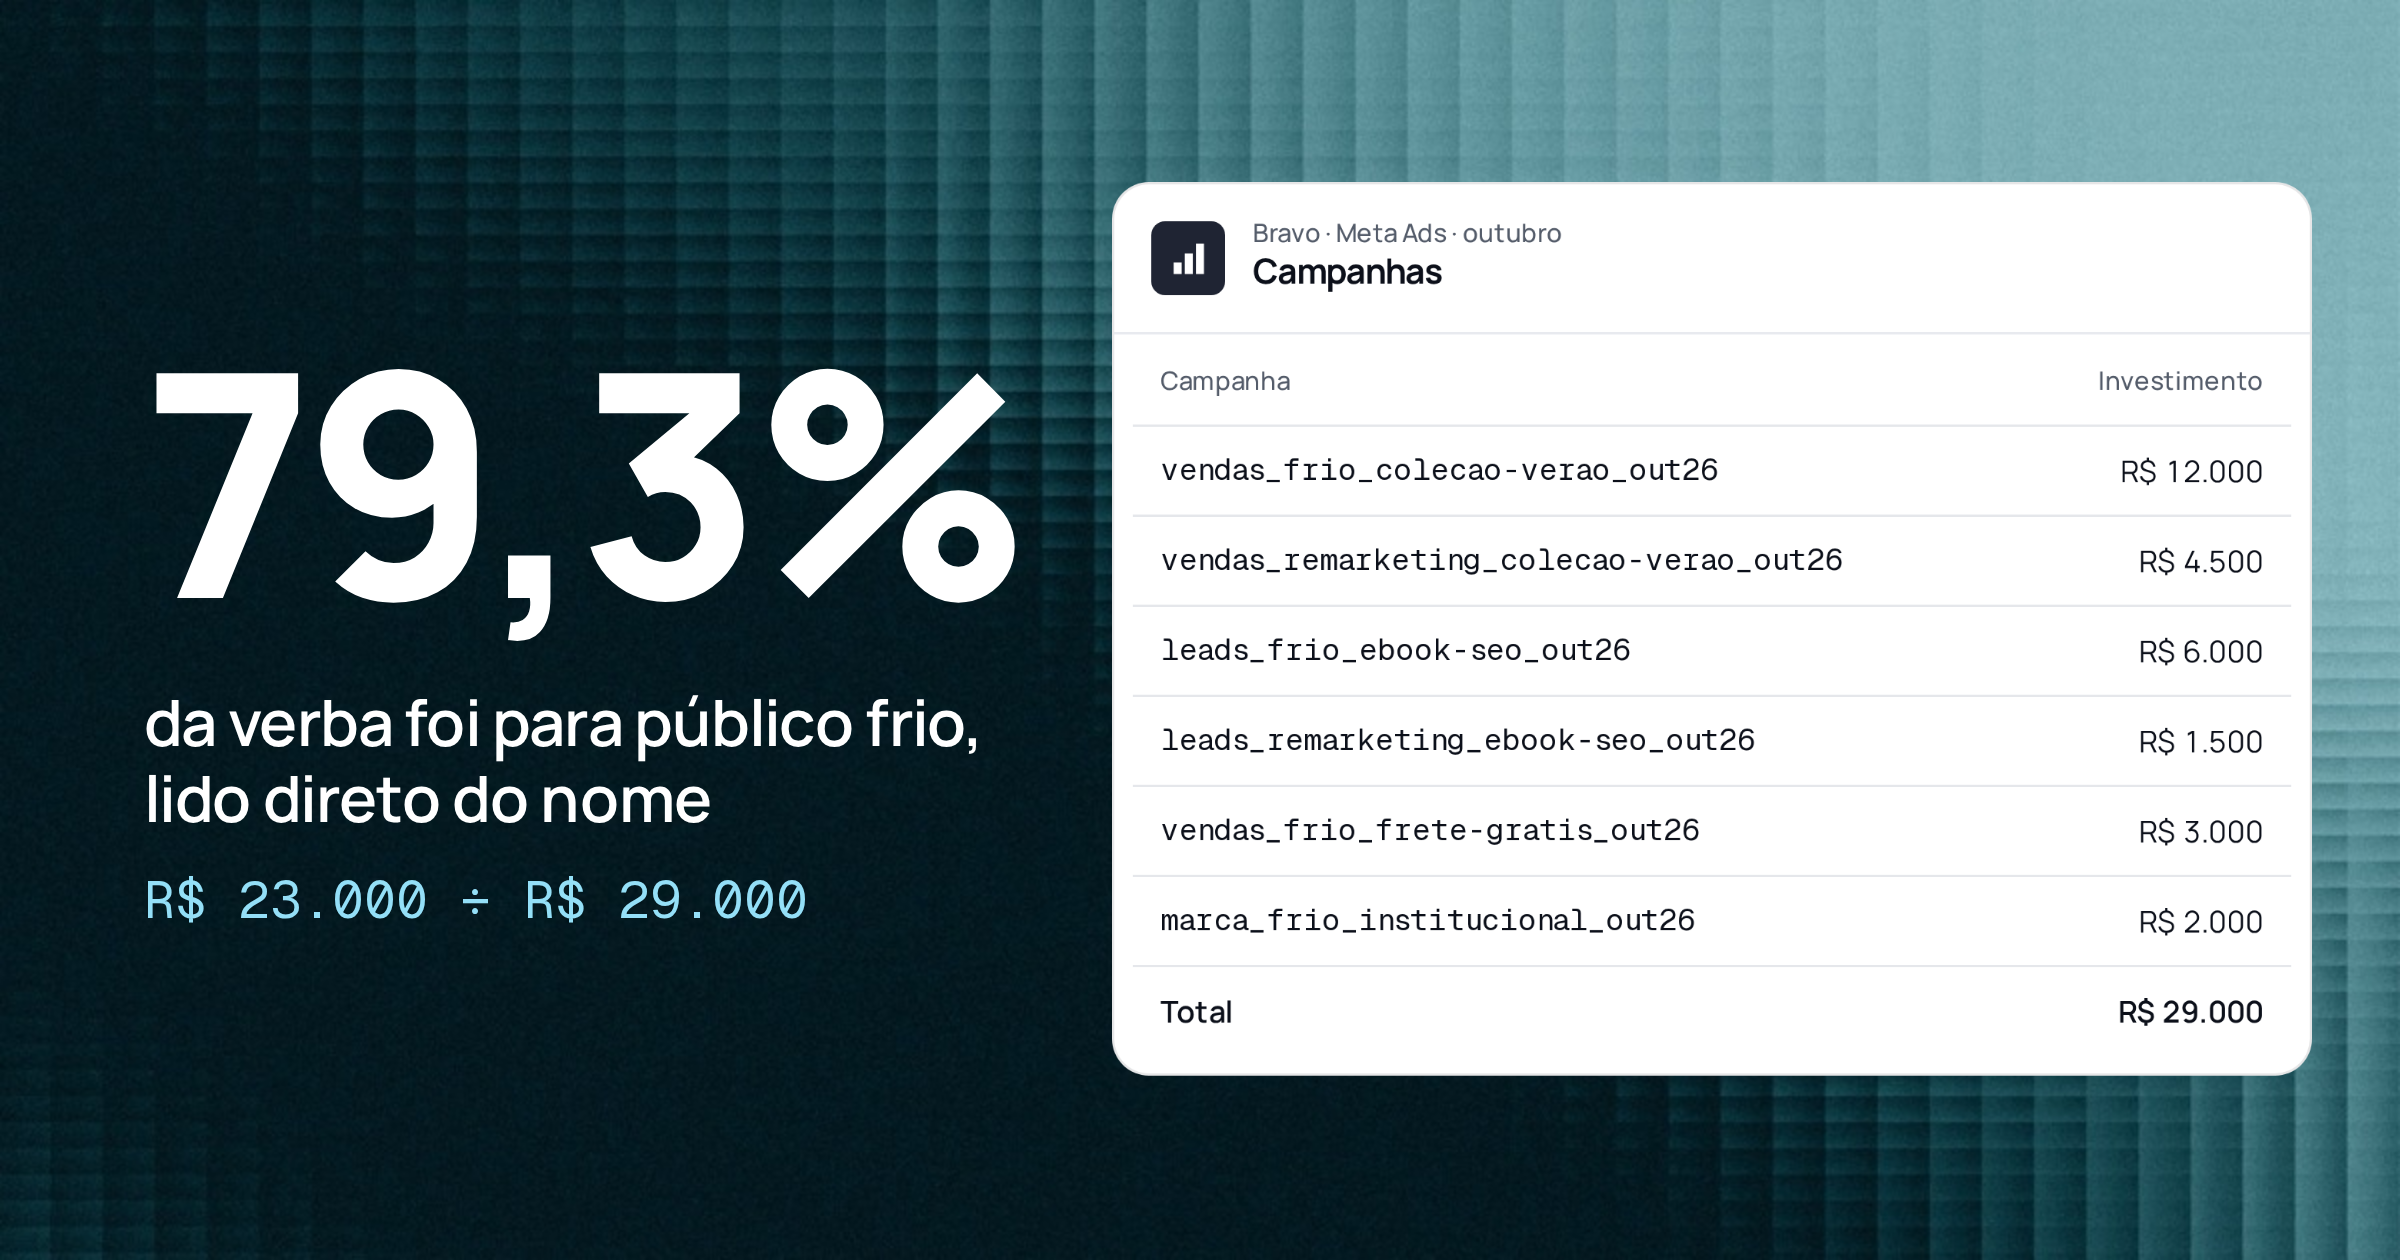
A name with fixed-position fields becomes a filter, a grouping and a report. See a simple taxonomy, the separators and how to validate the standard.
7 min read
Marketing data
UTMs without the mess: a standard that survives five people launching campaigns
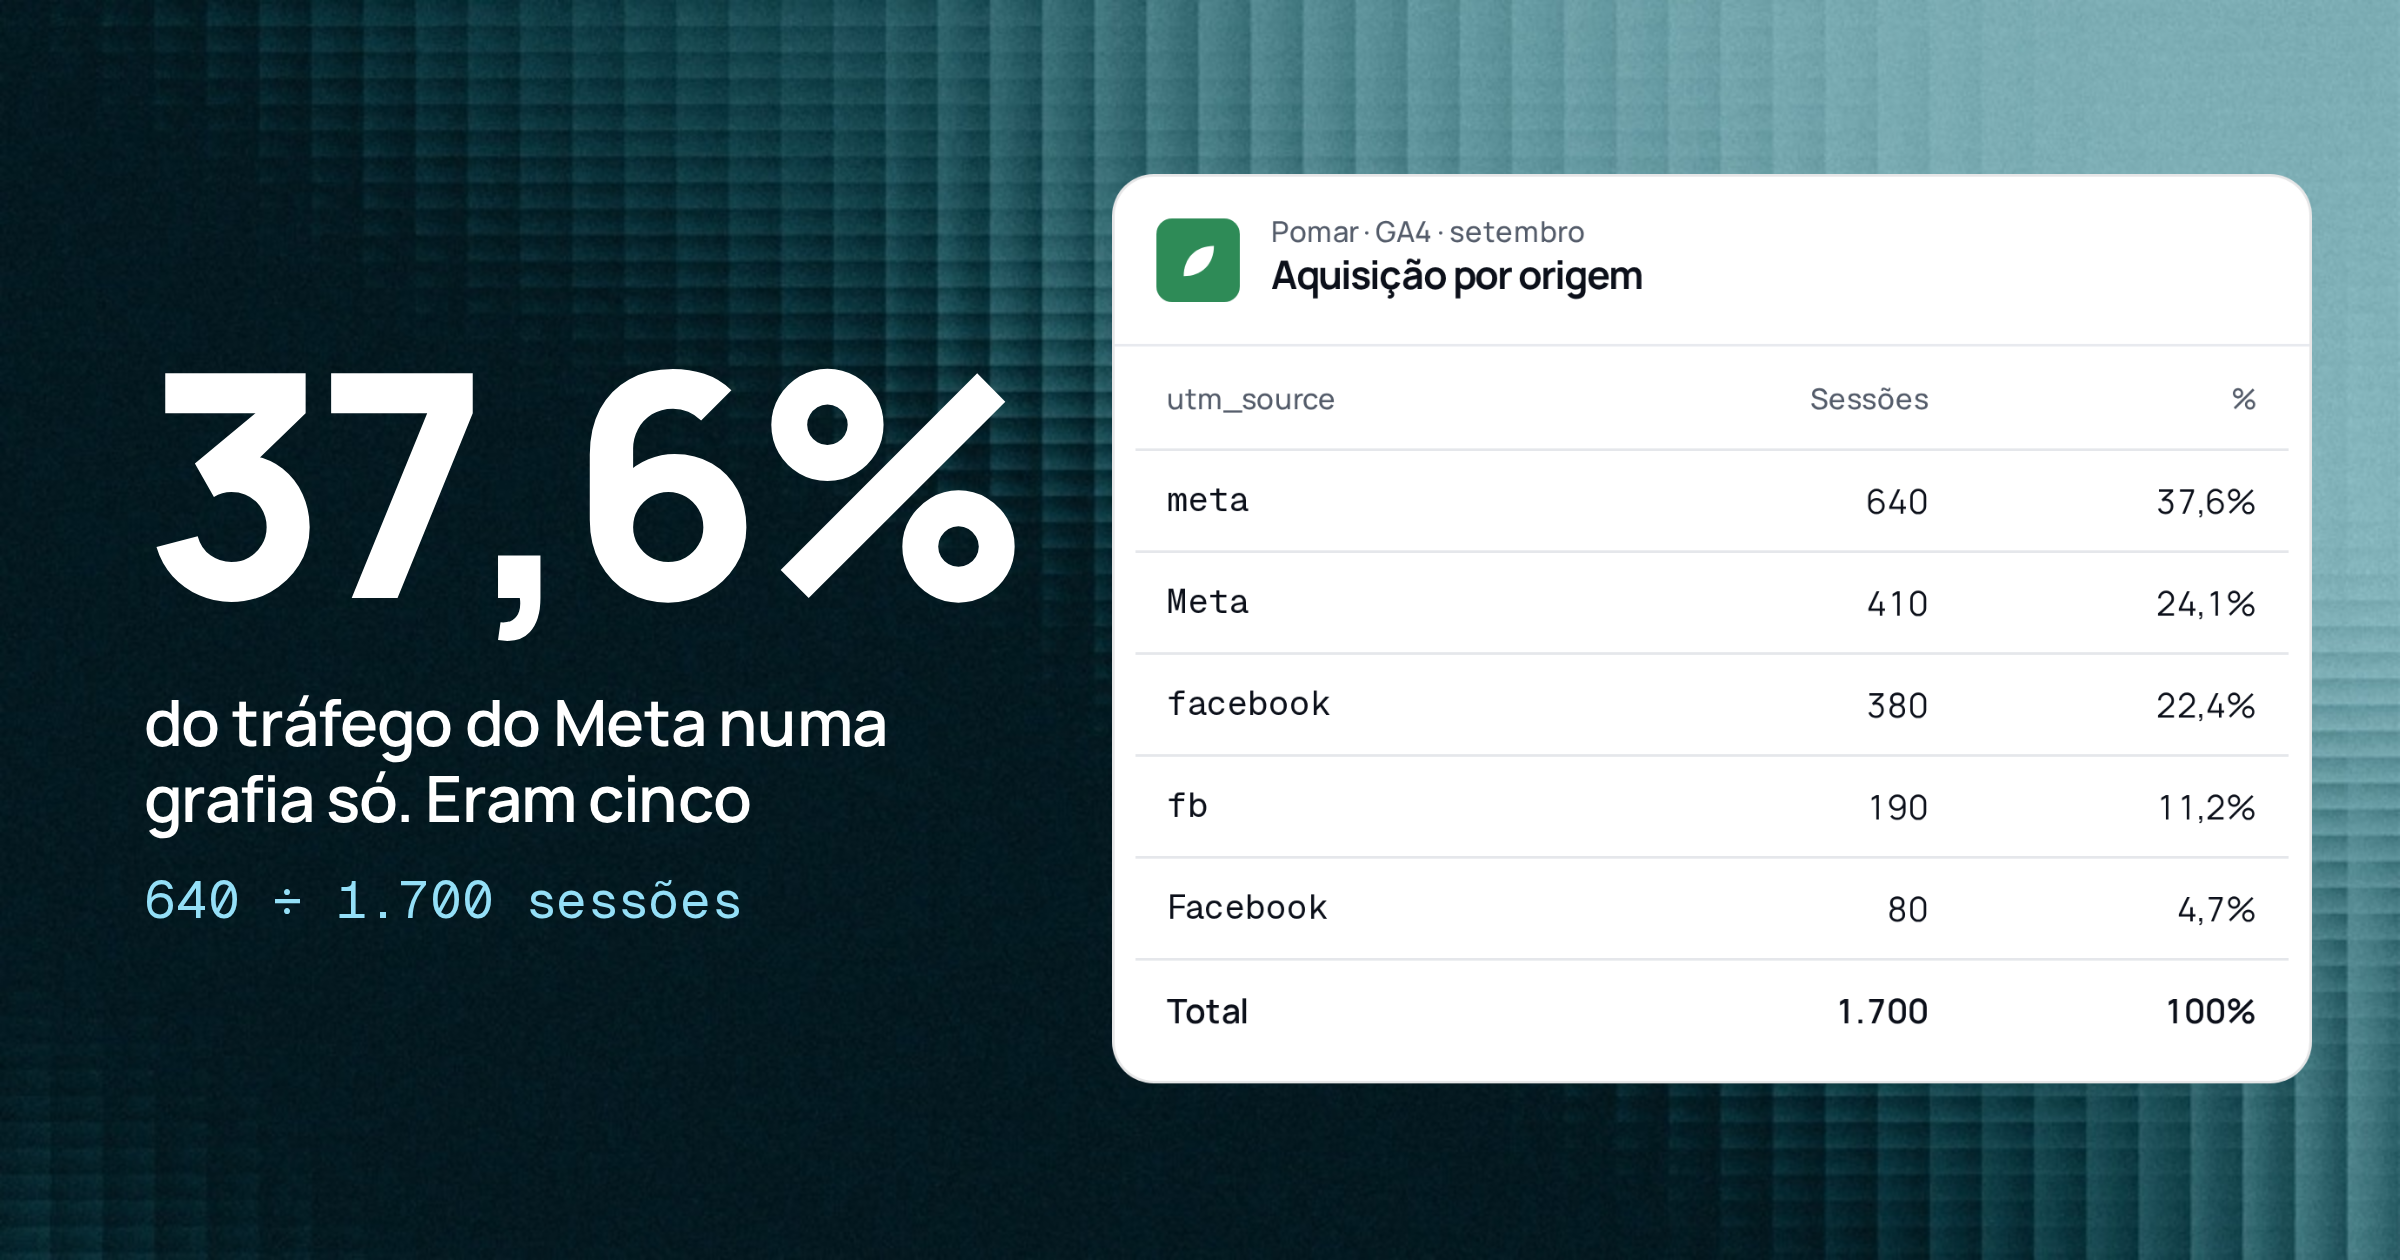
In GA4, "Meta" and "meta" become two sources. See the minimal UTM convention, what Google Ads auto-tagging already covers and how to validate before launch.
6 min read

Performance strategy
Which metric to check first: ROAS, CPA or margin? It depends on your business model
A ROAS of 3 can lose money and the cheapest CPL can bring the most expensive customer. Pick your main metric by how the business makes money.
9 min read
Marketing data
Averaging rates lies: why every metric needs exactly one definition
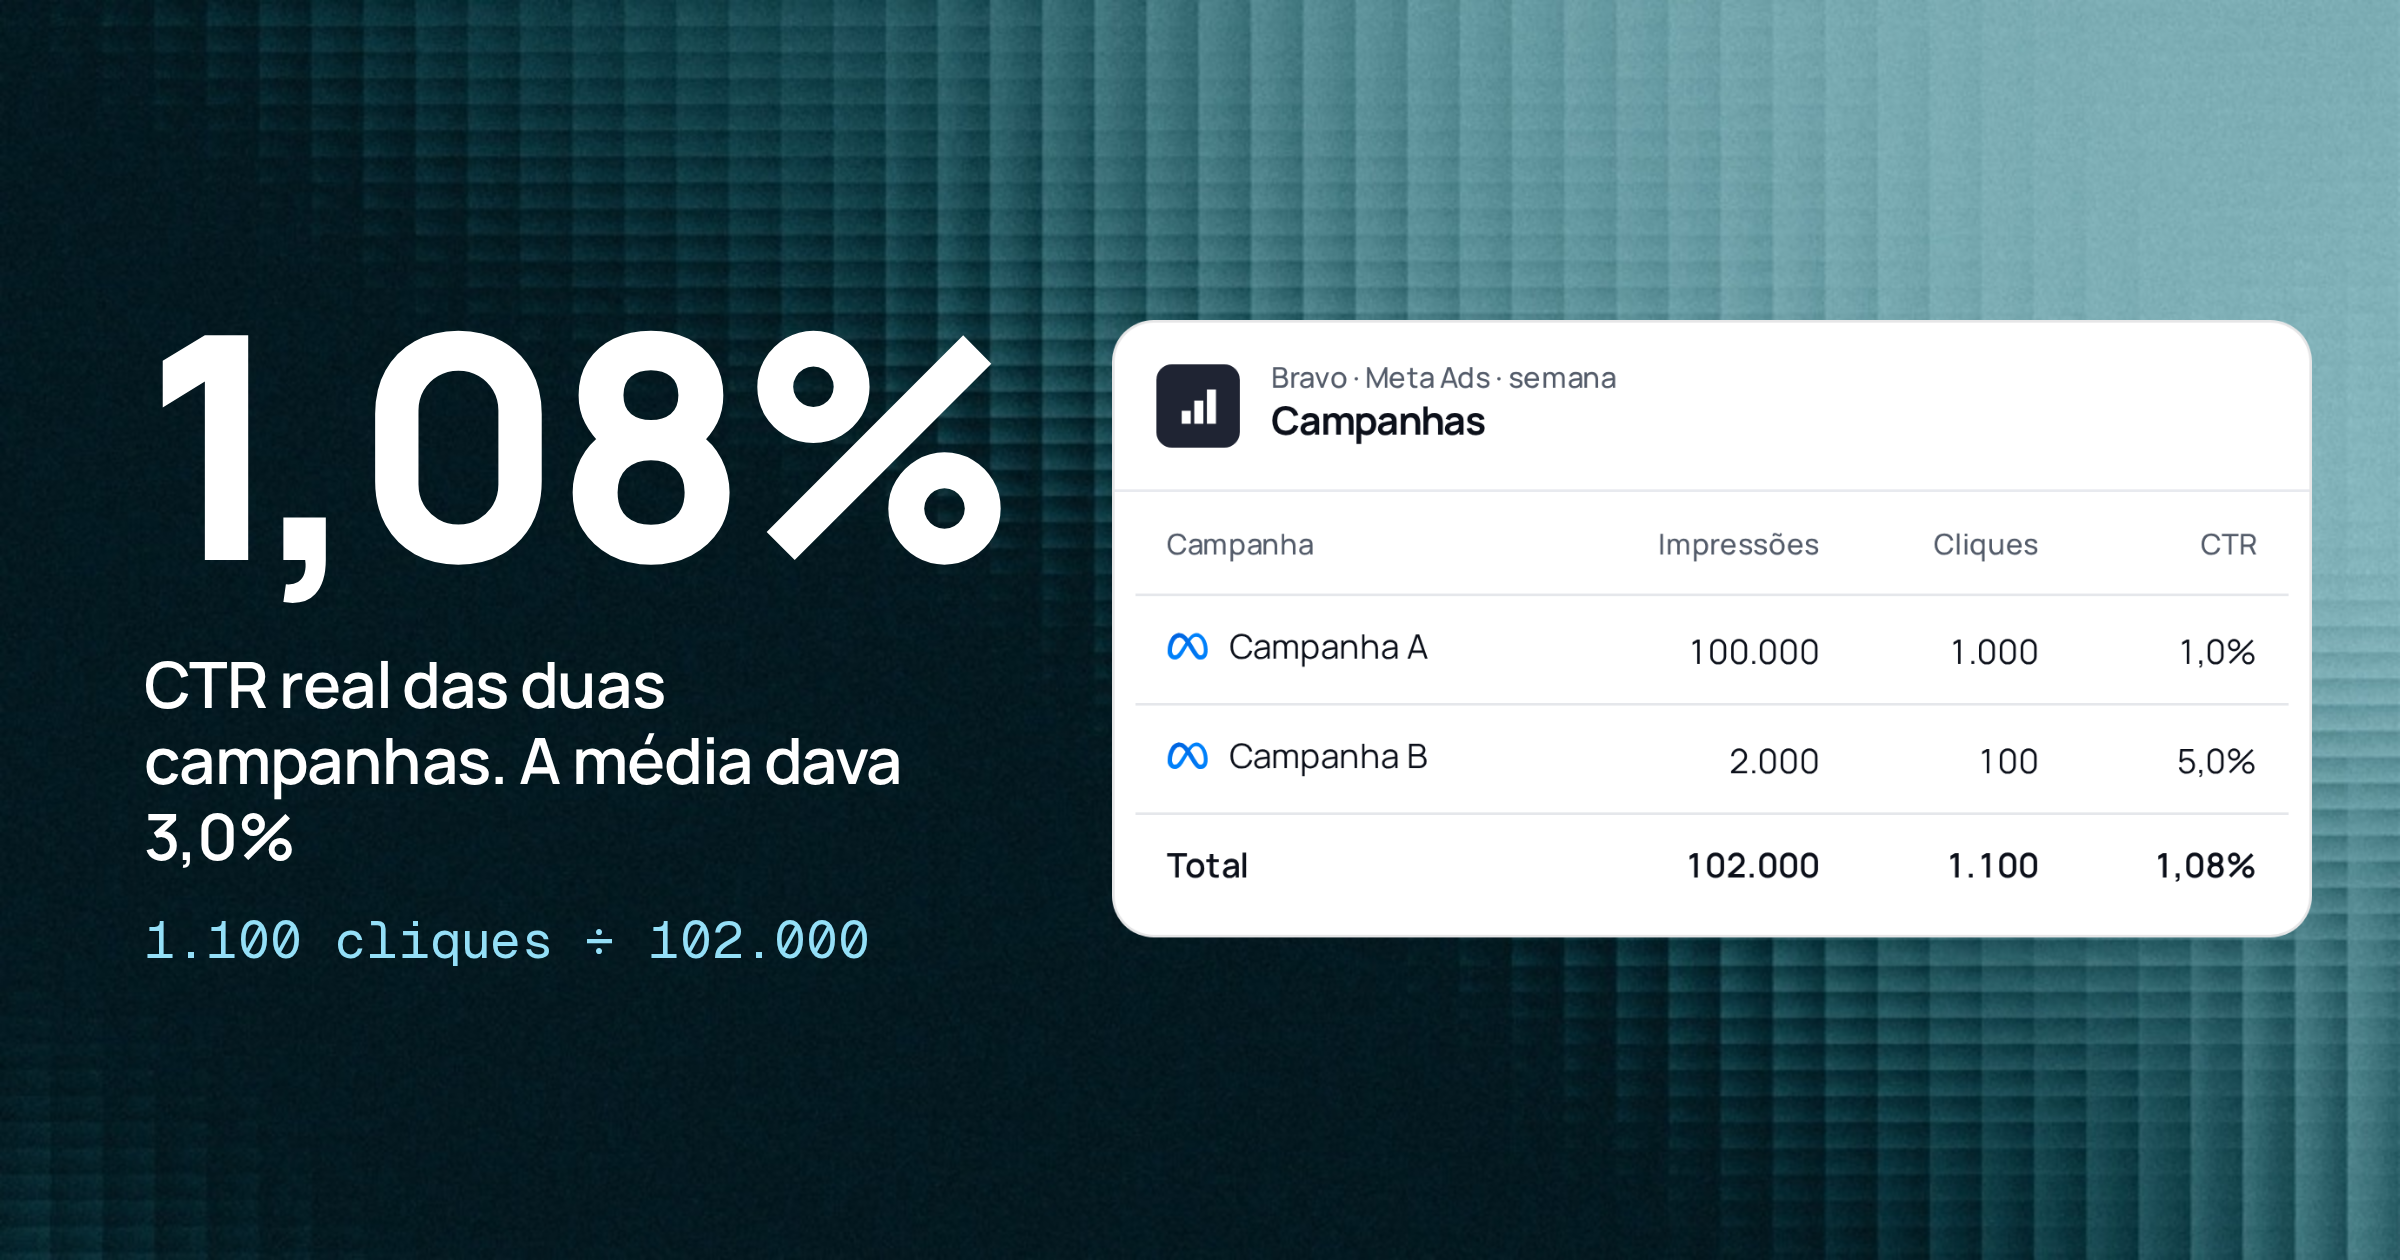
CTR, CPA and ROAS come from summing the numerator and denominator, never from averaging rates. See the mistake, the right math and how to lock each definition.
8 min read
AI & analytics
AI-ready marketing data: what to fix before you ask
Campaign names, UTMs, one definition per conversion, currency, time zone and a linked CRM. The checklist that keeps AI from being confidently wrong.
9 min read
Agency reporting
A client report is a product, not an attachment
The monthly report answers three questions, in this order: did we hit the goal, why, and what comes next. See the structure, the ritual and common mistakes.
8 min read

Marketing data
Who has access to your client's ad accounts? A governance guide for agencies
The client owns the accounts; the agency joins as a partner with minimum access. How to grant, audit and remove access and tokens in Meta and Google.
9 min read
Agency reporting
Why Meta, Google Ads and GA4 never show the same number
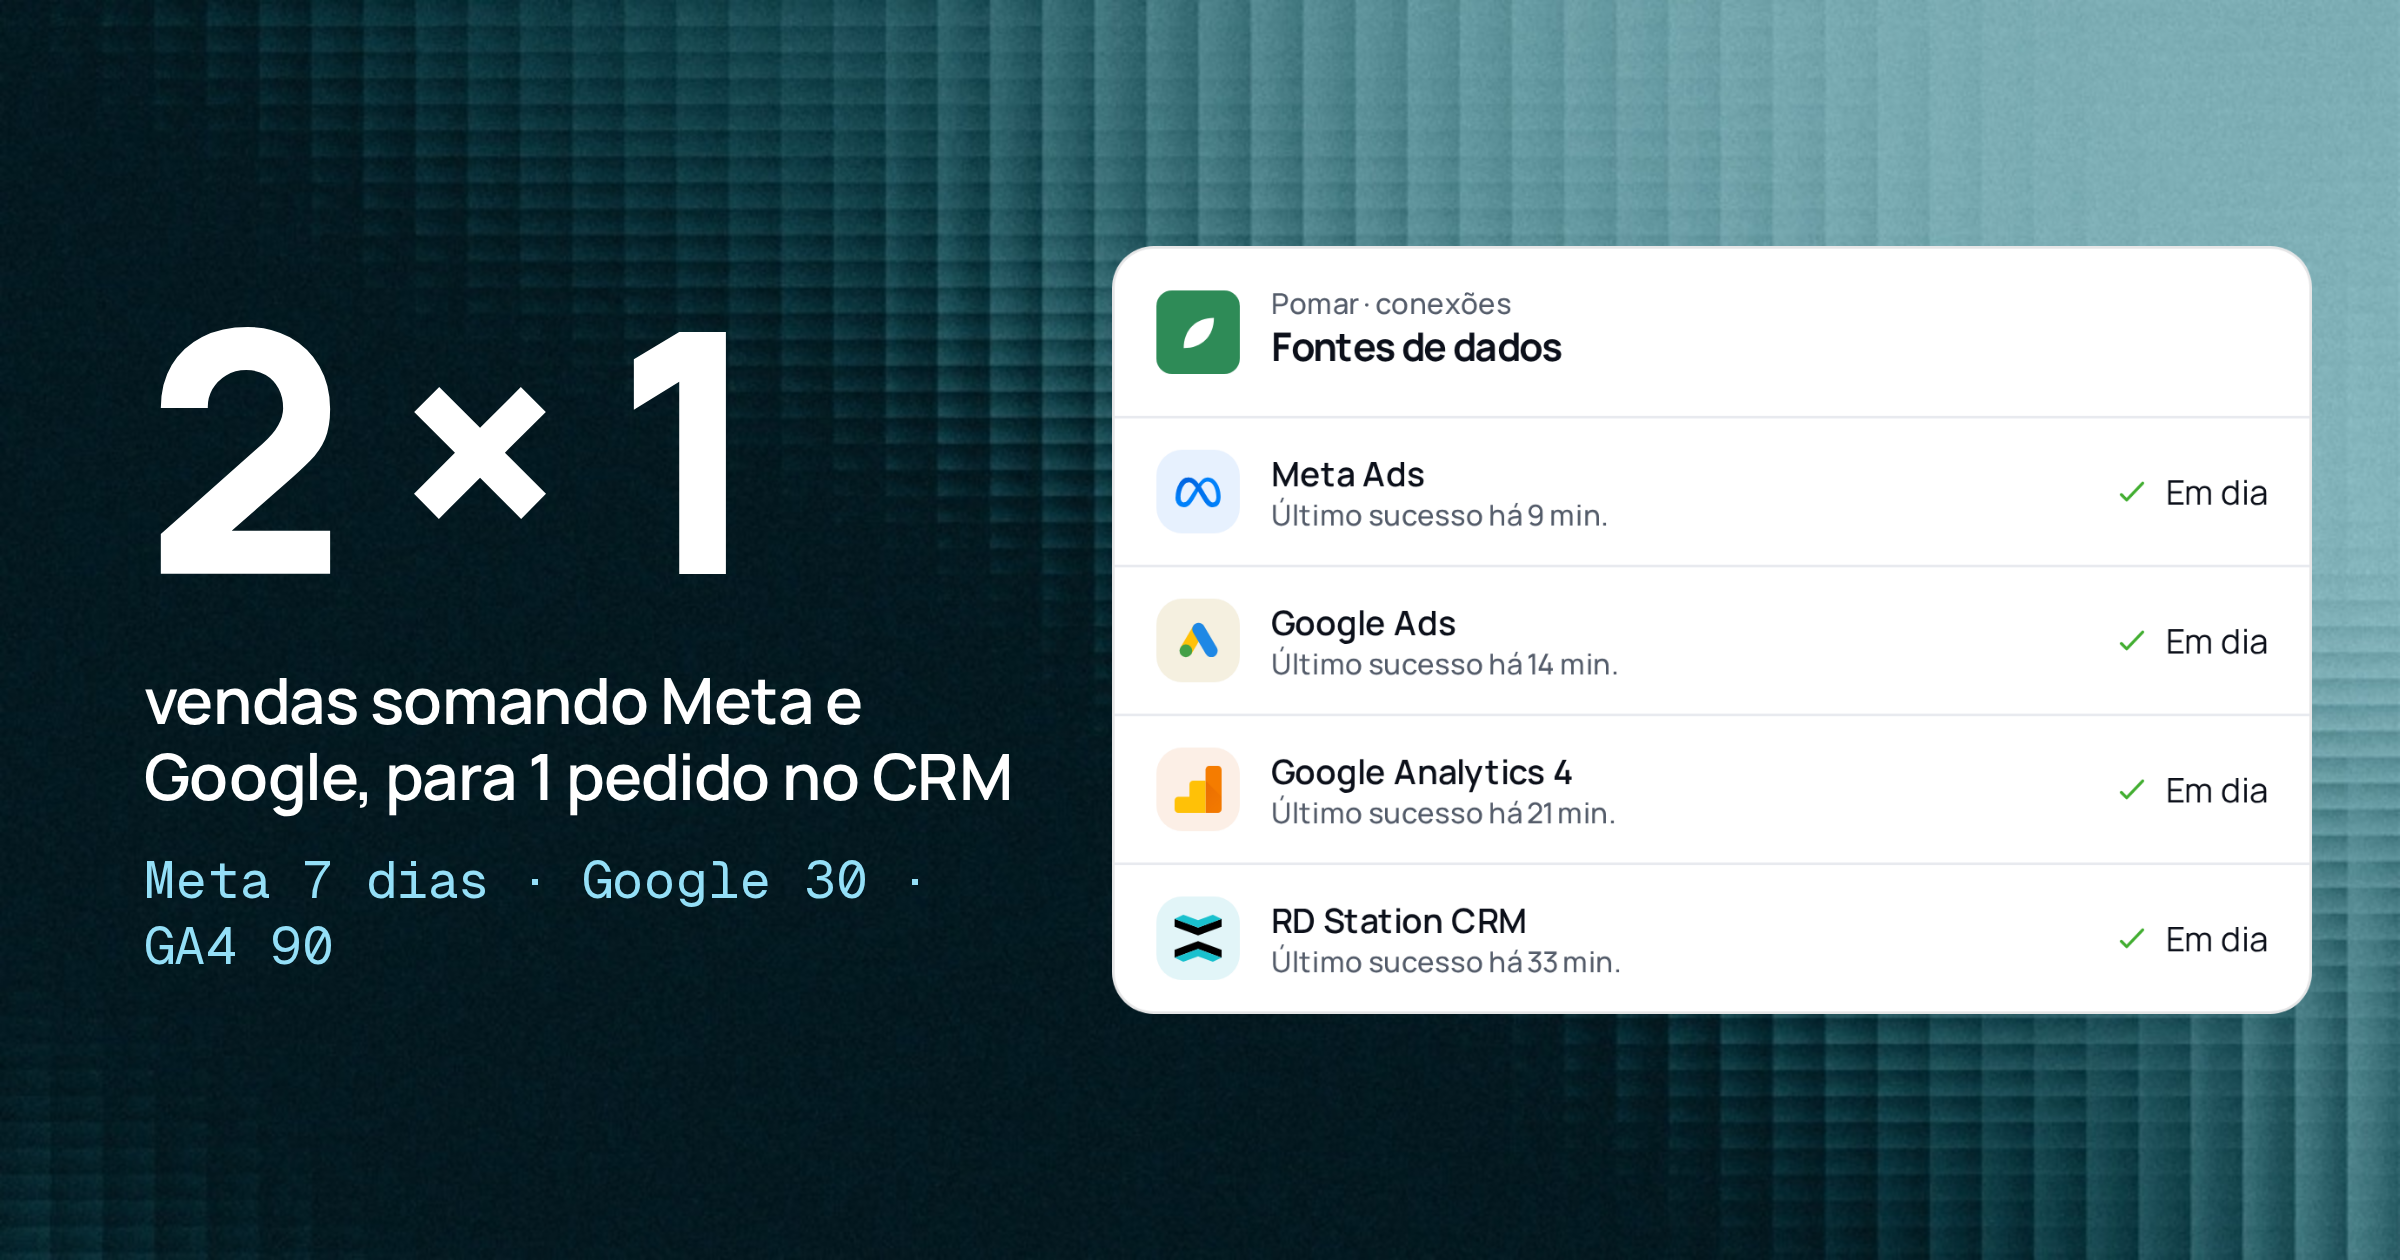
Attribution windows, the date a sale is recorded and the credit model explain almost the whole gap. Here is how to read all three without fighting any of them.
9 min read

Product updates
What Relator Digital does today and what it doesn't do yet
Sources, sync cadence, Performance, RelatorAI, approved reports, real ROAS, goals, plans and Relator's current limits, as of October 2026.
9 min read

Performance strategy
Platform ROAS, blended ROAS and CRM ROAS: which one to use for each decision
The three ROAS numbers answer different questions. See which to take to leadership, which to use for budget moves, and how incrementality tests link them.
9 min read
Your next month-end close can be the last one done in a spreadsheet.
Try it free for 7 days: connect your sources today and send the first report this week.