Platform ROAS, blended ROAS and CRM ROAS: which one to use for each decision
The three ROAS numbers answer different questions. See which to take to leadership, which to use for budget moves, and how incrementality tests link them.

Contents
There are three ROAS numbers, and each one answers a different question. Platform ROAS (what Meta and Google show) is for tactical decisions inside a channel. Blended ROAS, also called MER, is the number for leadership. CRM ROAS shows which channels brought in the closed sales. An incrementality test is what tells you how much of each number the media actually caused.
Three ROAS numbers, three different questions
ROAS (return on ad spend) is revenue divided by media spend. The formula is the same in all three cases. What changes is where the revenue comes from.
Platform ROAS
It is the revenue Meta Ads or Google Ads attributes to its own campaigns, divided by what you spent there. Each platform uses its own attribution window and model. On Meta, the attribution setting defines how many days after a click or a view a sale still counts. On January 12, 2026, Meta stopped returning the 7-day and 28-day view windows in the Insights API; what remains is 1, 7 and 28 days after a click, 1 day after a view and 1 day after an engaged view. In Google Ads, data-driven attribution is the default model for most conversion actions.
The point is that each platform only sees itself. If the same person clicked a Google ad and saw a Meta ad before buying, both can count the entire sale.
Blended ROAS or MER
MER (marketing efficiency ratio) is the business's total revenue for the period divided by total media spend. It does not try to say which channel sold. That is why it has no overlap: each unit of revenue appears only once. The price is that it also includes sales that would happen without ads (organic, referrals, returning customers), so it mixes media effect with brand strength.
CRM ROAS
It is the revenue from deals closed in the CRM or order system, tied to the lead's source channel (through the UTM, the click identifier or the source field), divided by the channel's spend. It counts real sales, not pixel events. It has no overlap either, because each deal has one recorded source. But that source is usually the first or last touch, and it does not prove the ad caused the purchase.
The sum of the platforms exceeds the revenue that exists
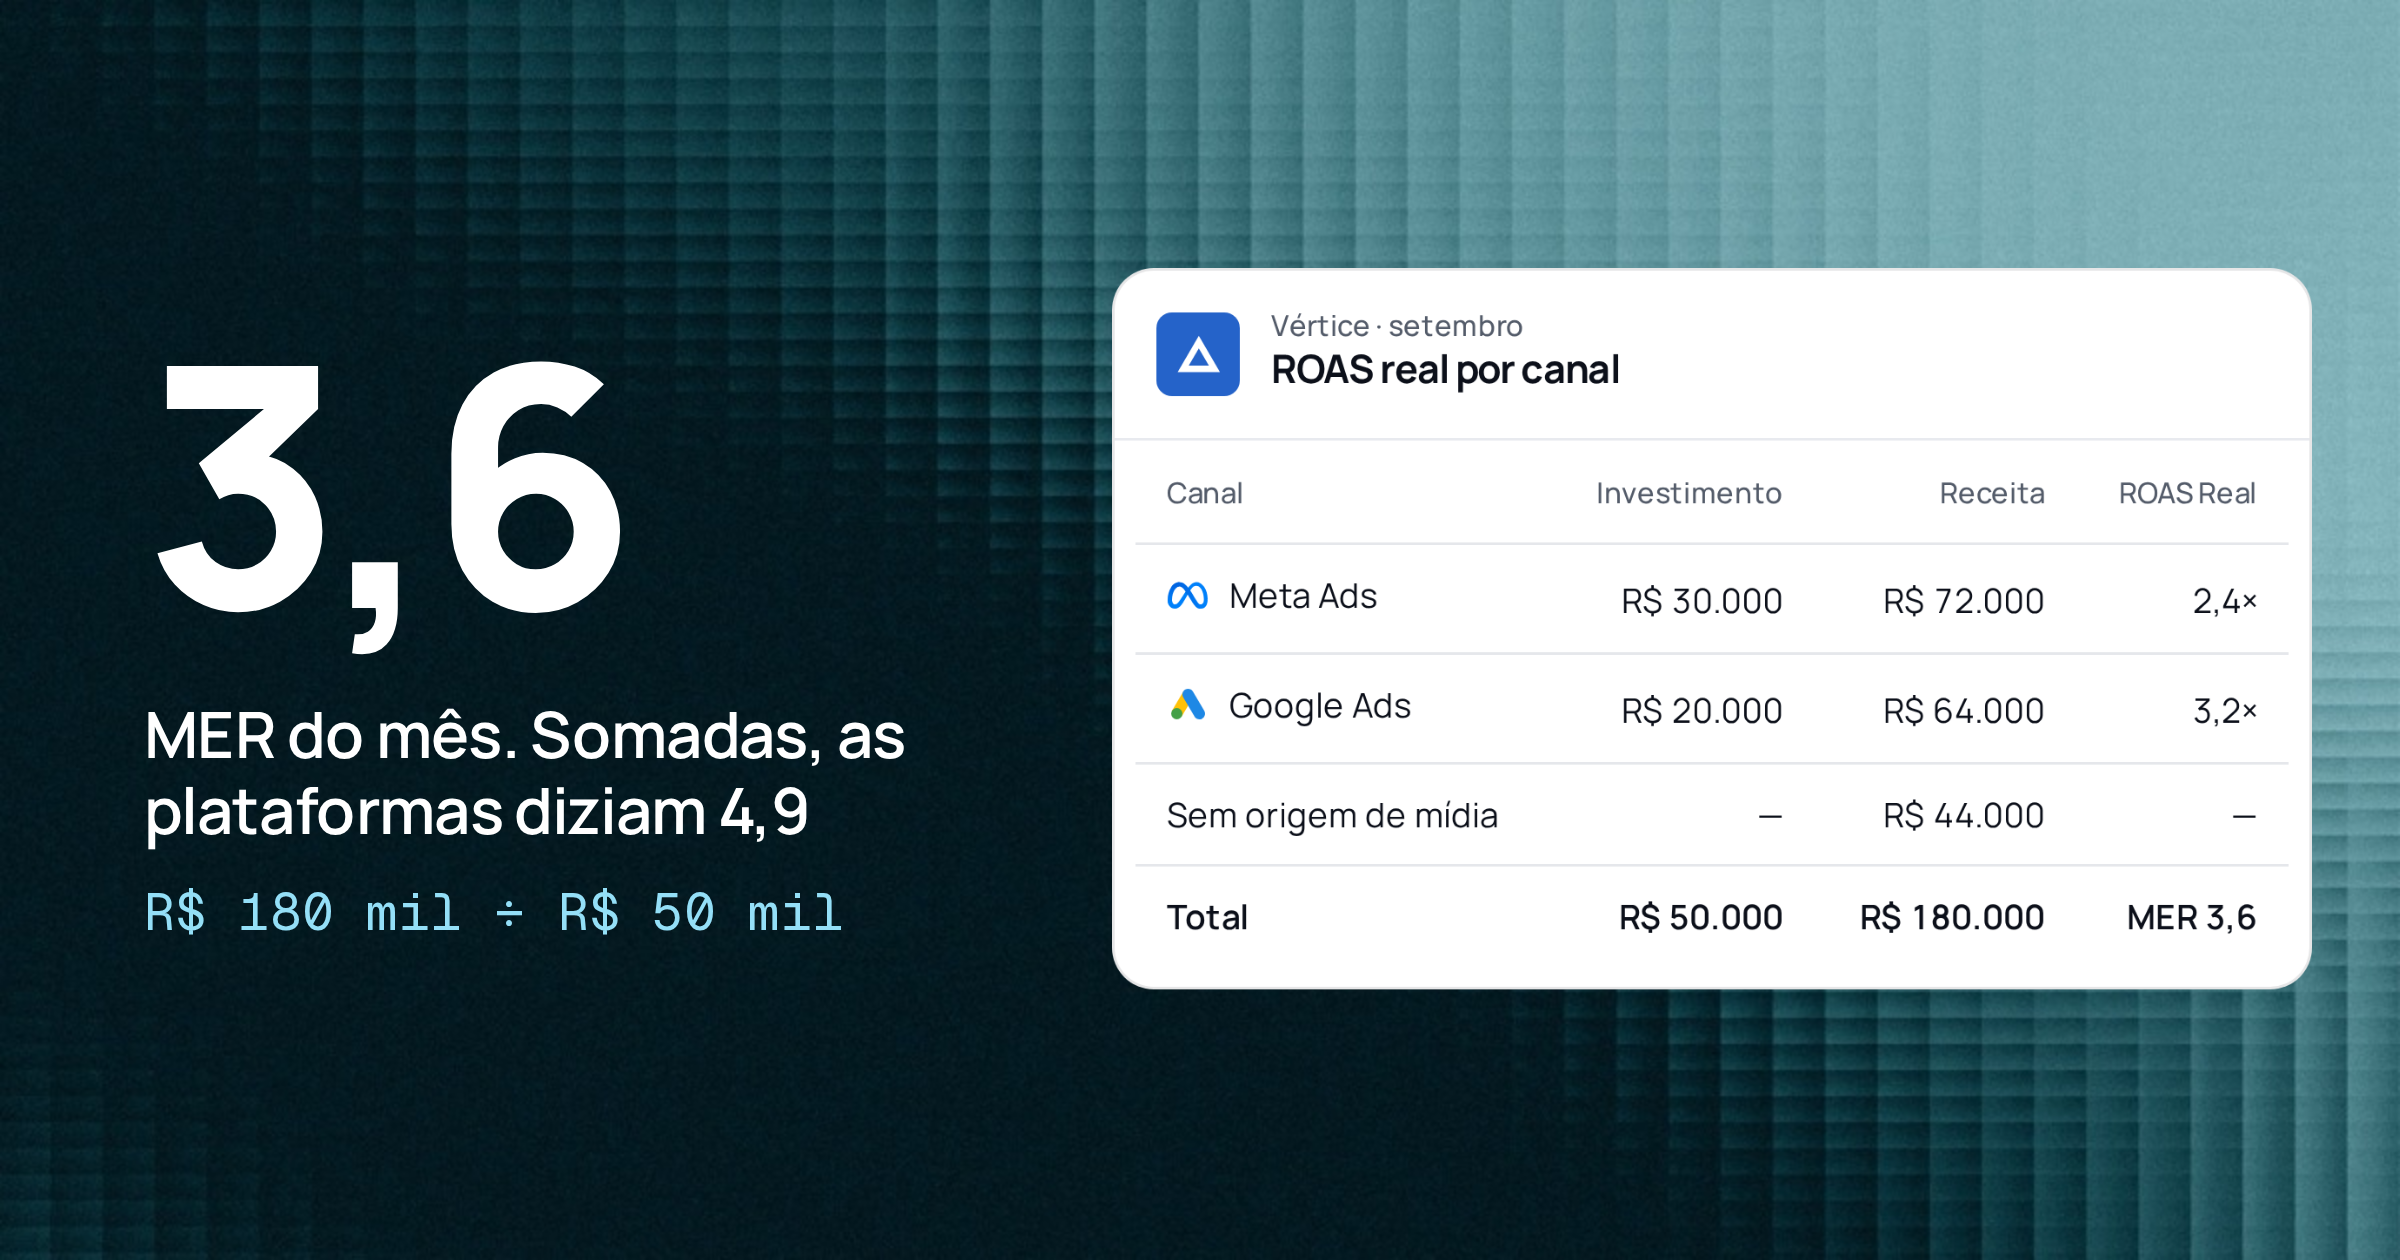
A hypothetical example makes the difference concrete. A store invests R$ 50,000 a month in media: R$ 30,000 on Meta Ads and R$ 20,000 on Google Ads. That month, total revenue was R$ 180,000.
Meta Ads
- Spend
- R$ 30,000
- Revenue the platform attributes
- R$ 135,000
- Platform ROAS
- 4.5
- Revenue in the CRM
- R$ 72,000
- CRM ROAS
- 2.4
Google Ads
- Spend
- R$ 20,000
- Revenue the platform attributes
- R$ 110,000
- Platform ROAS
- 5.5
- Revenue in the CRM
- R$ 64,000
- CRM ROAS
- 3.2
No media source
- Spend
- —
- Revenue the platform attributes
- —
- Platform ROAS
- —
- Revenue in the CRM
- R$ 44,000
- CRM ROAS
- —
Total
- Spend
- R$ 50,000
- Revenue the platform attributes
- R$ 245,000
- Platform ROAS
- 4.9
- Revenue in the CRM
- R$ 180,000
- CRM ROAS
- MER 3.6
| Channel | Spend | Revenue the platform attributes | Platform ROAS | Revenue in the CRM | CRM ROAS |
|---|---|---|---|---|---|
| Meta Ads | R$ 30,000 | R$ 135,000 | 4.5 | R$ 72,000 | 2.4 |
| Google Ads | R$ 20,000 | R$ 110,000 | 5.5 | R$ 64,000 | 3.2 |
| No media source | — | — | — | R$ 44,000 | — |
| Total | R$ 50,000 | R$ 245,000 | 4.9 | R$ 180,000 | MER 3.6 |
Added up, the platforms say media brought in R$ 245,000. The whole store earned R$ 180,000. Even if every sale that month had come from ads, R$ 65,000 of revenue would remain that was counted twice or never happened as a closed sale. The summed platform ROAS (4.9) is 36% higher than the MER (3.6).
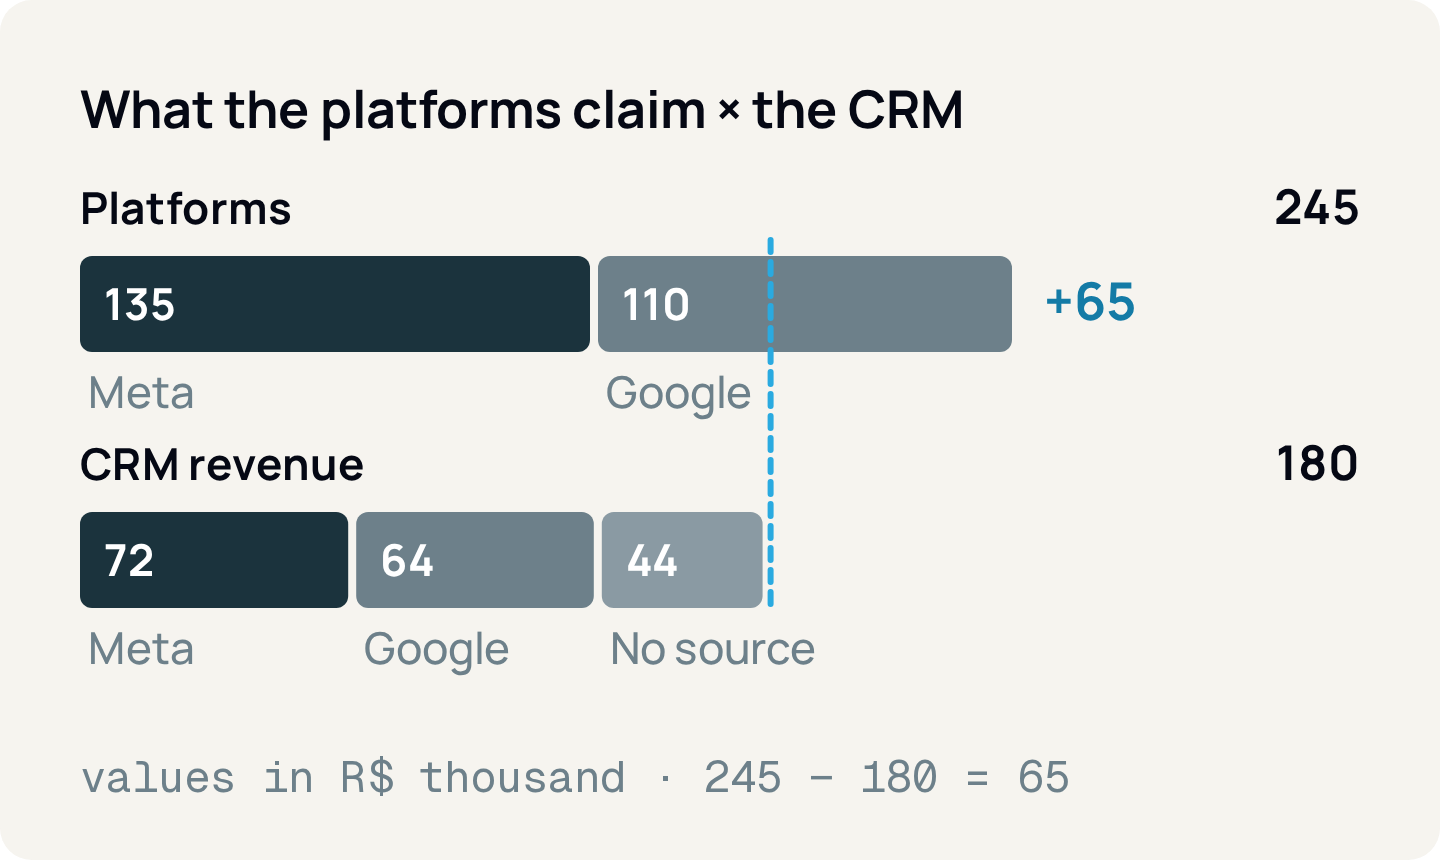
No platform is lying. Each applies its own attribution rule, and the rules overlap. The mistake is adding their numbers as if they were slices of the same pie.
For leadership, MER and contribution margin
Whoever answers for the company's results wants to know whether marketing pays for itself. MER answers that better than any channel ROAS, because it uses the revenue finance recognizes and the spend finance pays.
One piece is missing: margin. A ROAS of 3.6 can mean profit or loss, depending on how much is left from each sale. Calculate contribution margin, which is revenue minus product cost, shipping, sales taxes and payment fees. In the example, assume a 45% contribution margin before media:
- Contribution before media: R$ 180,000 × 45% = R$ 81,000.
- Contribution after media: R$ 81,000 − R$ 50,000 = R$ 31,000.
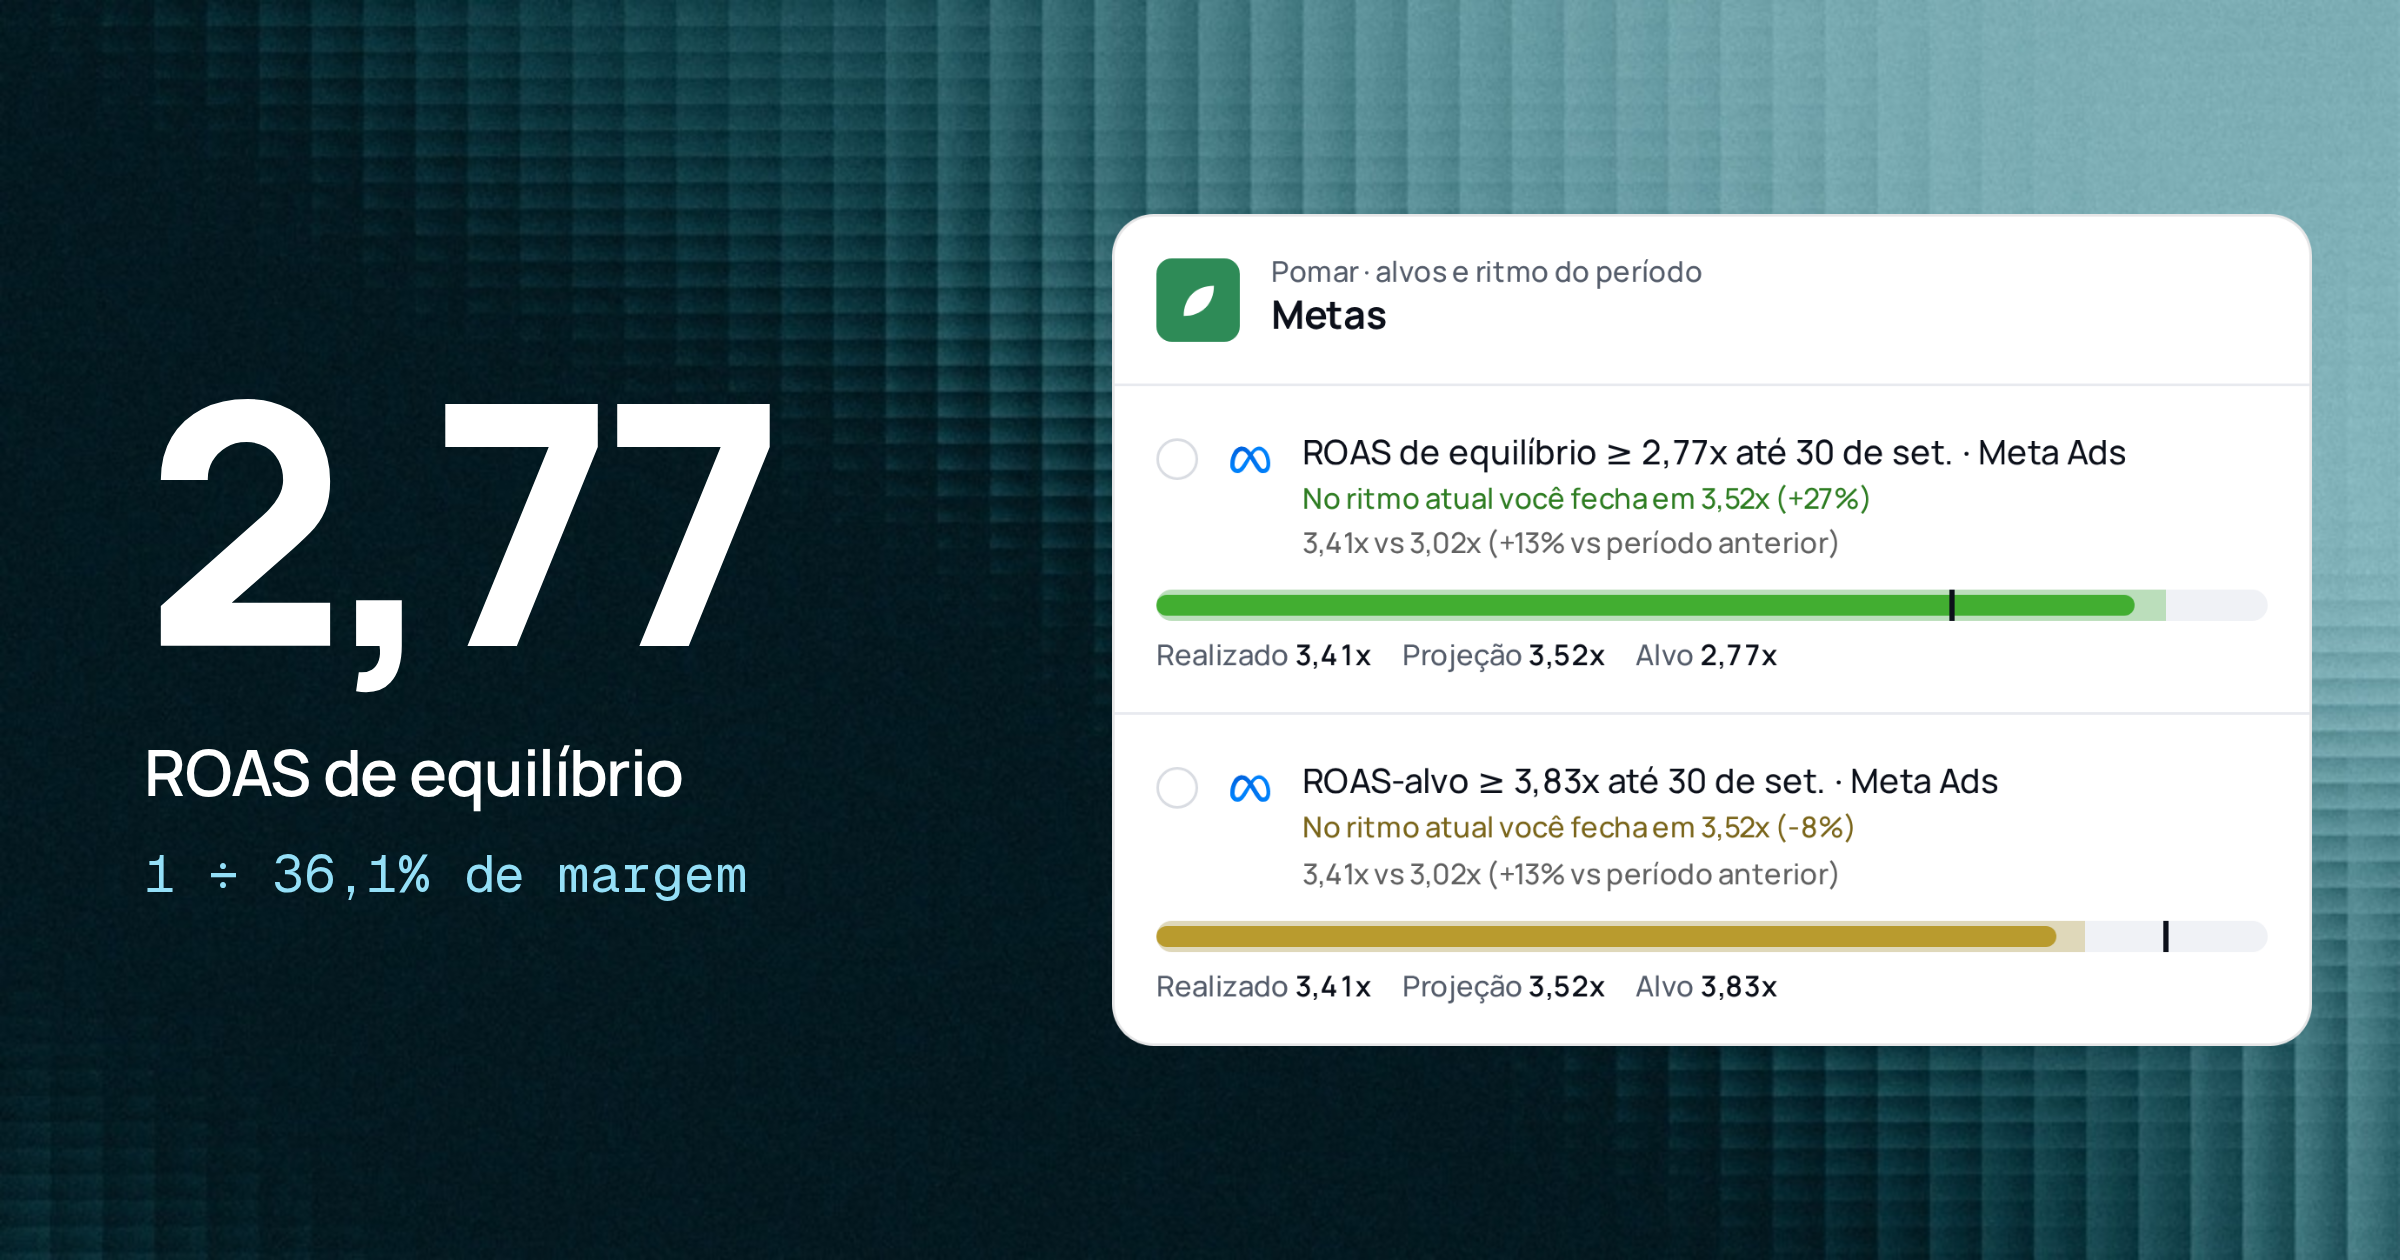
- Break-even MER: 1 ÷ 0.45 ≈ 2.22. Below that, media consumes more margin than it generates.
Take these three numbers to leadership, with the trend of the last few months. It is a conversation about profit, not about which platform has the nicest dashboard.
For day-to-day budget moves, the platform with care
Platform ROAS is still useful. It is the only one with data at the campaign, ad set and ad level, in near real time, and it is the signal the algorithm uses to optimize. To decide which creative to pause or which ad set to scale inside Meta, it is the right tool.
Three precautions keep the reading honest:
- Compare within the same platform and with the same attribution window. Meta ROAS next to Google ROAS does not tell you which channel is better.
- Watch the trend, not the level. If Meta ROAS went from 4.5 to 5.0 and MER stayed flat, Meta probably started claiming more sales, not generating more.
- Before moving budget between channels, check CRM ROAS and, when available, the result of an incrementality test.
The CRM shows who sold, not who caused the sale
CRM ROAS fixes the overlap: in the example, Meta gets 2.4 and Google 3.2, and the revenues add up to the R$ 180,000. It is the best number to answer "where did the closed sales come from".
It has two limits. First, it depends on the source being recorded properly: a lead without a UTM becomes "no source", and in the example that is R$ 44,000. Second, source is not cause. Someone who was already going to buy and clicked a search ad for the brand's own name shows up as a Google sale, but might have bought anyway.
Incrementality links the three numbers
The question none of the three answers alone is: if I turn this channel off, how much revenue do I lose? That is what an incrementality test is for. It separates a group that sees the ads from a control group that does not and measures the difference in conversions between them. That difference is the revenue the media caused, and divided by spend it gives incremental ROAS (iROAS).
The platforms offer versions of this test, with restrictions:
- Meta. The Experiments tool in Ads Manager creates lift tests with a test group and a holdout group, and the help center considers a lift result reliable at 90% confidence or more. The API documentation warns that Conversion Lift measurement is limited and asks you to contact a Meta representative for access. Check in Experiments what is enabled for your account.
- Google Ads. Conversion Lift comes in two versions: based on users and based on geography. Google's help says the feature is not available for all accounts and that access goes through your account representative. The user-based version requires at least 1,000 observed conversions and a minimum campaign budget of US$ 5,000; the geography-based version supports more campaign types (including Search, Shopping and Performance Max) and tends to need more budget. For Performance Max there are also uplift experiments, which you set up yourself on the Experiments page.
- A geographic test you run yourself. Without access to the platforms' tests, you can pause or reduce media in some regions that resemble others that keep running normally, and compare the real revenue of both (from finance or the CRM, not from the platform). Choose regions with similar past sales and run long enough to cover the purchase cycle.
Back to the example: suppose a control-group test on Meta showed R$ 48,000 in incremental revenue for the R$ 30,000 invested. The iROAS would be 1.6, against 4.5 on the platform and 2.4 in the CRM. With break-even MER at 2.22, this result would say that, on average, Meta does not pay for its own margin at this level of spend, something neither the platform nor the CRM showed. The factor 48 ÷ 135 ≈ 0.36 becomes a multiplier for reading Meta ROAS until the next test.
Teams with years of history and spend across several channels can go further with marketing mix models (MMM), such as Google's open-source Meridian. Even then, incrementality tests are used to calibrate the model.
Which ROAS answers which question
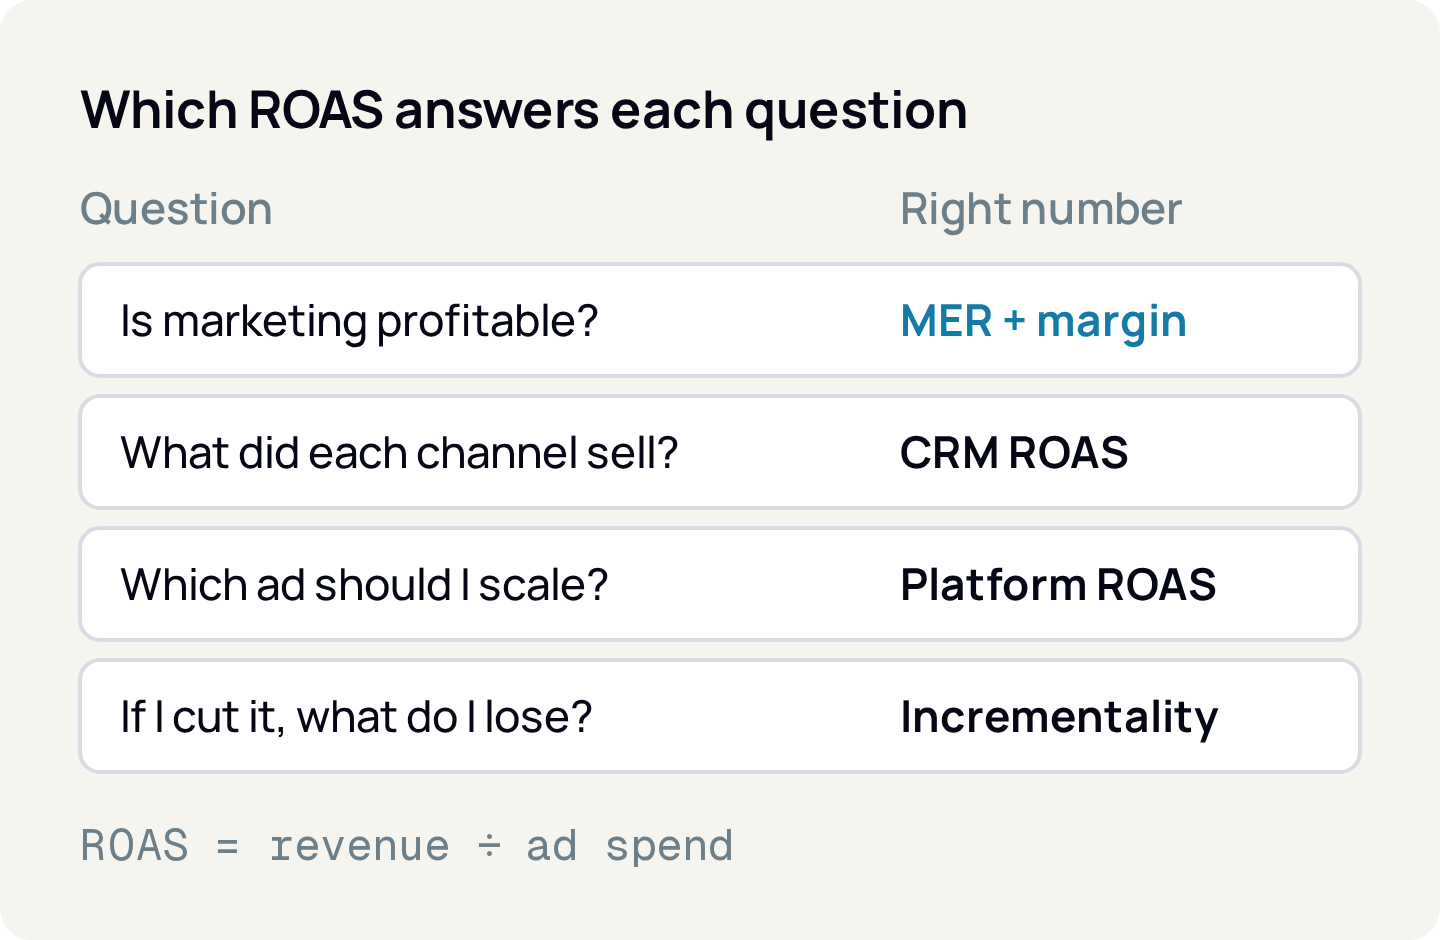
Is marketing profitable?
- Number
- MER and contribution margin
- Who uses it
- Leadership, finance
- Frequency
- Monthly
Which channels brought in the closed sales?
- Number
- CRM ROAS
- Who uses it
- Marketing manager, agency
- Frequency
- Weekly or monthly
Which campaign or ad to scale or pause?
- Number
- Platform ROAS
- Who uses it
- Media buyer
- Frequency
- Daily or weekly
If I cut this channel, how much do I lose?
- Number
- iROAS from the incrementality test
- Who uses it
- Marketing and leadership
- Frequency
- Quarterly or before major budget changes
| Question | Number | Who uses it | Frequency |
|---|---|---|---|
| Is marketing profitable? | MER and contribution margin | Leadership, finance | Monthly |
| Which channels brought in the closed sales? | CRM ROAS | Marketing manager, agency | Weekly or monthly |
| Which campaign or ad to scale or pause? | Platform ROAS | Media buyer | Daily or weekly |
| If I cut this channel, how much do I lose? | iROAS from the incrementality test | Marketing and leadership | Quarterly or before major budget changes |
Relator Digital brings Meta Ads, Google Ads, GA4 and the CRM (HubSpot or RD Station CRM) into one base and matches the deals won in the CRM with the campaign that brought in the lead. That way platform ROAS and CRM ROAS appear side by side, by campaign and by channel, in the same report.
How to apply
- 1.Calculate MER for the last 6 months: total revenue from finance divided by total media spend for each month.
- 2.Ask finance for the average contribution margin and calculate break-even MER (1 divided by the margin).
- 3.Add up the revenue each platform attributes for the same period and compare it with total revenue. The difference shows the size of the overlap.
- 4.Make sure every ad has UTMs and the CRM source field is filled in, and calculate CRM ROAS by channel.
- 5.For day-to-day decisions, use platform ROAS only within the channel, always with the same attribution window.
- 6.Pick the channel with the most spend and plan an incrementality test: the platform's, if your account has access, or a geographic test.
- 7.In the leadership meeting, show MER, contribution after media and the trend. Leave platform ROAS for the tactical meeting.
Sources
- Ads Insights API: metric availability updates (Meta for Developers, Oct 16, 2025)
- Conversion Lift Measurement — Marketing API (Meta for Developers)
- About confidence in your tests and experiments (Meta Business Help Center)
- About experiments (Meta Business Help Center)
- About data-driven attribution (Google Ads Help)
- About Conversion Lift (Google Ads Help)
- Set up Conversion Lift based on users (Google Ads Help)
- Comparing lift types (Google Ads Help)
- About Performance Max experiments (Google Ads Help)
- Meridian (Google for Developers)
About the author
João Vitor Moitinho
João Vitor Moitinho is the founder of Relator Digital. A computer engineer, he works on growth, measurement and martech, and writes here about what he learns building reports for performance agencies.
João Vitor Moitinho on LinkedInThis article is also available as Markdown, for agents and LLMs: view .md version